
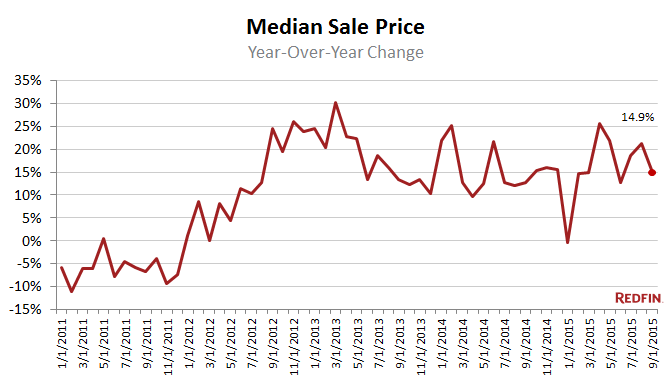
San Francisco home values rose nearly 15 percent in September from a year ago, posting a median sale price of $1.1 million. Across the greater Bay Area, prices rose 8.4 percent.
Fewer properties went on the market last month, with new listings falling 25 percent year over year. That helped push the number of sales down more than 25 percent from September 2014, the biggest drop in at least five years, leaving more properties on the market. The typical home sold in about two weeks.
While San Francisco remains firmly a million-dollar market, there are signs that its rapid price growth might be starting to peak as houses take a little longer to find buyers. There was a 2.2-month supply of homes for sale last month, double the August level and the most since early 2012.
Still, sellers showed no sign of retreat, pushing asking prices up 5.5 percent from a year earlier.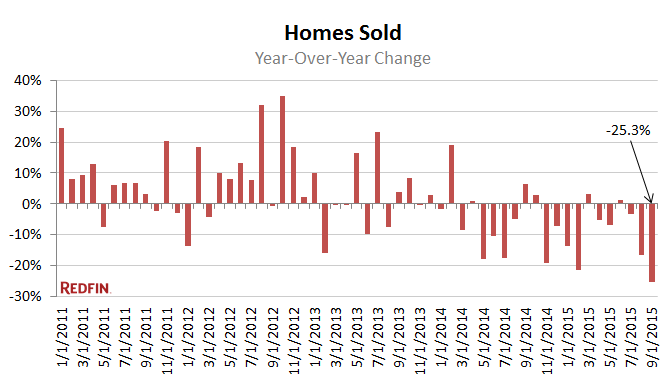
Hot Neighborhoods
Forest Hill was the city’s priciest area, with more than half of houses selling for $1.96 million or more. Hayes Valley and Western Addition had the biggest jump in median sale prices, up 59 percent and 57 percent respectively.
Two other high-end communities, Marina and Pacific Heights, saw sales fall year over year as a shortage of properties thwarted buyers. The inventory of homes for sale in Inner Sunset, where a typical home sold in a day, dropped more than 61 percent.
| Neighborhood | Median Sale Price | Year-Over-Year | Homes sold | Year-Over-Year | Inventory | Year-Over-Year |
|---|---|---|---|---|---|---|
| Ashbury Heights | $1,640,600 | 25.8% | 9 | -40.0% | 8 | 33.3% |
| Bayview | $714,300 | 14.8% | 42 | 0.0% | 17 | -34.6% |
| Bernal Heights | $1,198,200 | 18.6% | 59 | 0.0% | 27 | 0.0% |
| Civic Center / Van Ness | $706,200 | 4.7% | 30 | 0.0% | 22 | 120.0% |
| Crocker-Amazon | $868,100 | 25.7% | 17 | -19.0% | 9 | 200.0% |
| Excelsior | $869,700 | 20.1% | 29 | -6.5% | 15 | -16.7% |
| Financial District | $1,703,300 | 40.7% | 12 | 0.0% | 9 | 28.6% |
| Forest Hill | $1,961,400 | 16.3% | 9 | 28.6% | NA | NA |
| Haight-Ashbury | $1,506,800 | 27.9% | 11 | -21.4% | 10 | -16.7% |
| Hayes Valley | $1,410,800 | 59.0% | 8 | 100.0% | 9 | 800.0% |
| Ingleside | $895,500 | 27.5% | 6 | -57.1% | 8 | 100.0% |
| Ingleside Heights | $637,100 | 0.0% | 17 | -5.6% | 6 | -45.5% |
| Inner Richmond | $1,433,100 | -2.5% | 17 | -32.0% | 10 | -16.7% |
| Inner Sunset | $1,264,000 | -10.1% | 25 | 177.8% | 5 | -61.5% |
| Lower Haight | $1,236,100 | 13.1% | 18 | 38.5% | 7 | -22.2% |
| Marina | $1,479,600 | -27.4% | 35 | -7.9% | 14 | -39.1% |
| Miraloma Park | $1,310,600 | 28.4% | 36 | 24.1% | 11 | -42.1% |
| Mission | $1,111,700 | 28.2% | 25 | -32.4% | 15 | -28.6% |
| Mission Bay | $1,053,300 | 24.8% | 39 | -7.1% | 9 | -40.0% |
| Nob Hill | $1,613,900 | 57.1% | 21 | -25.0% | 13 | 116.7% |
| Noe Valley | $1,893,500 | 21.3% | 56 | 1.8% | 23 | 4.5% |
| Outer Mission | $765,000 | 12.2% | 9 | -35.7% | 4 | -55.6% |
| Outer Richmond | $1,234,100 | 25.6% | 28 | -3.4% | 14 | 180.0% |
| Outer Sunset | $1,025,300 | 23.8% | 35 | -22.2% | 16 | -11.1% |
| Pacific Heights | $1,356,900 | -28.4% | 40 | -16.7% | 35 | 9.4% |
| Parkside | $1,172,000 | 22.1% | 27 | -40.0% | 9 | -35.7% |
| Portola | $879,600 | 9.1% | 15 | 0.0% | 8 | -50.0% |
| Potrero Hill | $1,254,500 | 24.2% | 41 | -25.5% | 20 | 25.0% |
| Rincon Hill | $997,000 | 4.7% | 25 | 0.0% | 20 | -4.8% |
| Russian Hill | $1,376,300 | -19.7% | 19 | -24.0% | 15 | -6.3% |
| South of Market | $996,400 | 14.2% | 143 | -21.0% | 88 | 10.0% |
| Sunnyside | $1,269,300 | 25.3% | 15 | 0.0% | 6 | -45.5% |
| Sunset District | $1,201,400 | 22.5% | 129 | -7.9% | 43 | -36.8% |
| Telegraph Hill | $1,094,300 | -17.4% | 8 | -42.9% | 10 | 25.0% |
| Tenderloin | $707,300 | -3.6% | 6 | 50.0% | 6 | 100.0% |
| Twin Peaks | $923,300 | 28.3% | 9 | 50.0% | 3 | -50.0% |
| Visitacion Valley | $748,800 | 10.0% | 23 | -17.9% | 14 | -22.2% |
| Western Addition | $820,500 | 57.4% | 11 | 37.5% | 5 | 150.0% |
| San Francisco, CA | $1,100,000 | 14.9% | 325 | -25.3% | 702 | 1.2% |
| Neighborhood | New Listings | Median Days on Market | Avg Sale-to-List |
|---|---|---|---|
| Ashbury Heights | 15 | 16 | 117.2% |
| Bayview | 42 | 19 | 113.3% |
| Bernal Heights | 74 | 14 | 119.8% |
| Civic Center / Van Ness | 49 | 15 | 111.2% |
| Crocker-Amazon | 28 | 20 | 111.8% |
| Excelsior | 41 | 15 | 116.1% |
| Financial District | 21 | 6 | 106.8% |
| Forest Hill | 4 | 22 | 117.4% |
| Haight-Ashbury | 23 | 21 | 107.7% |
| Hayes Valley | 24 | 13 | 112.2% |
| Ingleside | 13 | 18 | 112.7% |
| Ingleside Heights | 25 | 20 | 109.5% |
| Inner Richmond | 17 | 14 | 113.3% |
| Inner Sunset | 23 | 14 | 122.0% |
| Lower Haight | 18 | 15 | 114.2% |
| Marina | 35 | 14 | 109.4% |
| Miraloma Park | 41 | 15 | 113.9% |
| Mission | 47 | 15 | 117.2% |
| Mission Bay | 39 | 15 | 105.4% |
| Nob Hill | 32 | 12 | 106.9% |
| Noe Valley | 70 | 14 | 116.4% |
| Outer Mission | 19 | 21 | 108.1% |
| Outer Richmond | 36 | 15 | 116.9% |
| Outer Sunset | 50 | 14 | 124.8% |
| Pacific Heights | 62 | 13 | 109.6% |
| Parkside | 31 | 15 | 123.6% |
| Portola | 20 | 14 | 116.1% |
| Potrero Hill | 50 | 15 | 114.6% |
| Rincon Hill | 43 | 17 | 103.3% |
| Russian Hill | 26 | 14 | 111.5% |
| South of Market | 208 | 15 | 103.9% |
| Sunnyside | 14 | 19 | 115.2% |
| Sunset District | 158 | 15 | 121.7% |
| Telegraph Hill | 15 | 16 | 104.6% |
| Tenderloin | 13 | 12 | 114.1% |
| Twin Peaks | 9 | 14 | 109.0% |
| Visitacion Valley | 29 | 24 | 108.4% |
| Western Addition | 16 | 11 | 109.4% |
| San Francisco, CA | 772 | 15 | 113.0% |
NOTE: Not all neighborhoods are listed, but totals for San Francisco encompass entire city. Data is based on listing information and might not reflect all real estate activity in the market. Neighborhood data is measured over the three months ended Sept. 30. Inventory measures listings active as of Sept. 30.
For more information, contact Redfin journalist services:
Phone: 206-588-6863
Email: press@redfin.com


