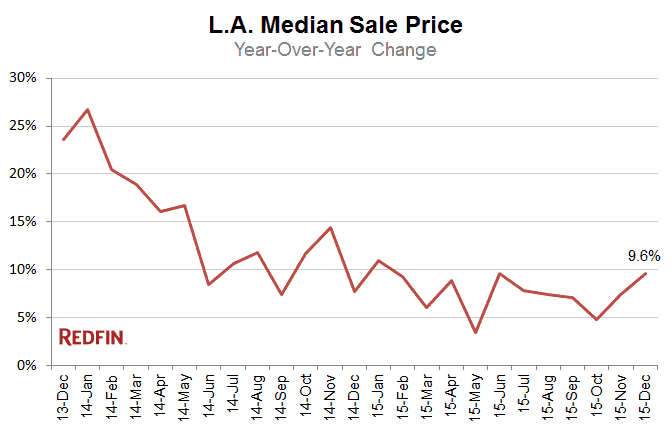
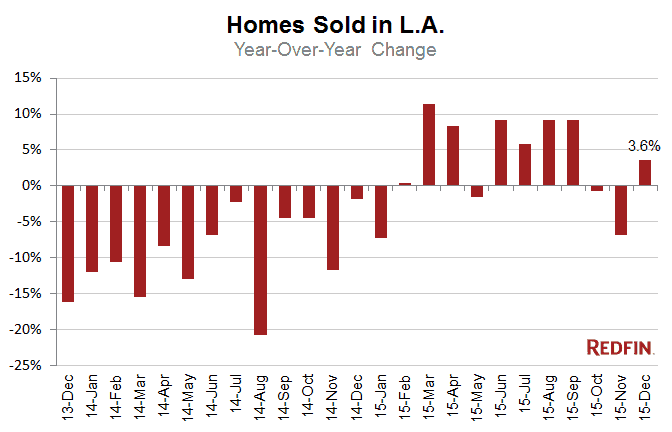
The Los Angeles median home sale price rose 9.6 percent in December from a year earlier to $559,000, the largest annual increase since June. Home sales increased 3.6 percent over last year in a late-season rally.

The number of homes for sale in Los Angeles plummeted 20 percent in December compared to a year earlier, the city’s largest inventory decline since July 2013. More homes were sold in December than new listings were added to the market, giving savvy buyers an opportunity to snap up older properties that might have fallen off the radar.

“Inventory typically declines in December due to the holiday season,” Redfin agent Nikki Kilmer said. “This year something very interesting occurred. Sellers overpriced their homes in October and November thinking they could fetch high-season prices. As a result, these homes sat on the market longer than usual, as buyers were unwilling to overpay. Once December rolled around many of my clients took a second look at these homes and were able to negotiate a better price.”
Hot Neighborhoods and Area Trends
The Eastside continued to be incredibly competitive. The median sale price in Echo Park increased 25.3 percent in December to more than $800,000, making it nearly as expensive as tony Marina Del Rey.
Mount Washington also posted impressive numbers, especially for December. Prices increased 25.2 percent year over year, the typical home sold within 16 days and half of all homes sold went for more than asking.
West Adams in South L.A. is turning heads thanks to revitalization and a relatively low median sale price of $525,000. Competition reached a fever pitch last month as buyers priced out of the Westside flocked to this traditionally working-class neighborhood. The median sale price jumped 27 percent over last year and the average home sold for 102 percent of asking price. The typical home sold in 14 days, twice as fast as the same time last year.
Here’s what’s happening in your neighborhood.
| Neighborhood | Median Sale Price | Year-Over-Year | Homes Sold | Year-Over-Year | Inventory | Year-Over-Year | New Listings | Median Days on Market | Avg Sale-to-List |
|---|---|---|---|---|---|---|---|---|---|
| Beverly Glen | $2,050,000 | 52.0% | 22 | 46.7% | 35 | -18.6% | 23 | 40 | 96.1% |
| Beverly Hills Post Office | $2,400,000 | 39.1% | 55 | 7.8% | 109 | -6.0% | 72 | 34 | 95.4% |
| Brentwood | $1,437,500 | -17.9% | 110 | -11.3% | 154 | 23.2% | 125 | 22 | 98.2% |
| Central LA | $850,000 | 3.0% | 770 | -6.8% | 1,053 | -5.1% | 1,010 | 27 | 97.7% |
| Century City | $932,500 | 8.1% | 84 | 9.1% | 93 | -13.1% | 80 | 22 | 98.9% |
| Chatsworth | $535,000 | 9.2% | 117 | 3.5% | 112 | -32.5% | 117 | 22 | 97.2% |
| Cheviot Hills | $1,411,417 | -19.2% | 14 | -30.0% | 24 | 50.0% | 26 | 20 | 95.9% |
| Crenshaw | $560,000 | 0.0% | 44 | 91.3% | 37 | -24.5% | 44 | 15 | 100.9% |
| Downtown (Los Angeles, CA) | $605,000 | 7.1% | 82 | -9.9% | 114 | -5.0% | 101 | 32 | 97.4% |
| Eagle Rock | $700,000 | 7.7% | 69 | -4.2% | 61 | -1.6% | 79 | 21 | 101.6% |
| East LA | $625,000 | 19.6% | 594 | 5.7% | 612 | -1.1% | 702 | 19 | 100.3% |
| Encino | $697,500 | -0.6% | 173 | -2.3% | 193 | -14.6% | 191 | 29 | 96.5% |
| Fox Hills | $438,000 | 7.5% | 20 | -33.3% | 13 | -50.0% | 27 | 12 | 101.5% |
| Glassell Park | $625,000 | 8.0% | 83 | 130.6% | 45 | 2.3% | 78 | 7 | 99.4% |
| Greater Echo Park Elysian | $813,000 | 25.3% | 66 | 40.4% | 91 | 28.2% | 73 | 19 | 100.1% |
| Hancock Park | $2,626,388 | 26.6% | 18 | 5.9% | 18 | 100.0% | 17 | 35 | 98.1% |
| Highland Park | $612,000 | 14.9% | 81 | -24.3% | 91 | -3.2% | 102 | 20 | 99.9% |
| Hollywood | $750,000 | -4.8% | 61 | -22.8% | 114 | 31.0% | 102 | 28 | 98.9% |
| Hollywood Hills West | $1,150,000 | 0.0% | 171 | 4.3% | 252 | -1.6% | 226 | 24 | 97.4% |
| Holmby Hills | $1,239,000 | -33.0% | 11 | 22.2% | 19 | -24.0% | 13 | 25 | 95.0% |
| Lake Balboa | $475,000 | 11.1% | 87 | -12.1% | 70 | -28.6% | 83 | 15 | 99.1% |
| Marina del Rey | $878,000 | 17.1% | 75 | -18.5% | 63 | -23.2% | 72 | 15 | 98.9% |
| Mid-City | $825,000 | 4.4% | 137 | -3.5% | 143 | -27.0% | 147 | 22 | 98.7% |
| Mount Washington | $720,000 | 25.2% | 72 | 2.9% | 60 | 11.1% | 71 | 16 | 102.0% |
| North Hollywood | $475,000 | 11.8% | 132 | -5.7% | 156 | -18.8% | 153 | 26 | 98.9% |
| North Valley | $450,000 | 6.9% | 1,216 | 5.5% | 1,169 | -28.4% | 1,269 | 21 | 98.6% |
| Northwest San Pedro | $478,000 | 8.6% | 81 | 52.8% | 60 | -23.1% | 76 | 24 | 99.1% |
| Pacific Palisades | $2,450,000 | 23.8% | 83 | -1.2% | 125 | 21.4% | 111 | 32 | 97.1% |
| Pacoima | $365,000 | 14.1% | 71 | 6.0% | 76 | -42.9% | 90 | 21 | 100.4% |
| Panorama City | $415,000 | 9.8% | 57 | 9.6% | 39 | -50.0% | 52 | 16 | 101.2% |
| Sherman Oaks | $775,500 | 10.0% | 221 | -9.8% | 237 | -5.2% | 257 | 19 | 98.1% |
| Silver Lake | $874,000 | -4.5% | 80 | -7.0% | 96 | 5.5% | 95 | 22 | 99.1% |
| South Central LA | $344,250 | 7.6% | 189 | -6.4% | 323 | -15.2% | 292 | 28 | 98.0% |
| South LA | $375,000 | 10.6% | 792 | -3.3% | 1,342 | -9.8% | 1,204 | 23 | 98.7% |
| South Valley | $535,000 | 7.1% | 1,516 | -1.4% | 1,547 | -24.1% | 1,586 | 24 | 97.8% |
| Studio City | $981,700 | 13.9% | 139 | 8.6% | 181 | 11.0% | 181 | 25 | 96.8% |
| Sun Valley | $421,500 | 7.3% | 71 | -15.5% | 75 | -30.6% | 86 | 22 | 99.2% |
| Sylmar | $400,000 | 8.1% | 147 | 15.7% | 148 | -33.0% | 159 | 24 | 98.9% |
| Tarzana | $595,000 | 32.7% | 129 | 7.5% | 150 | -14.3% | 141 | 27 | 97.1% |
| Valley Village | $816,500 | 22.8% | 42 | -17.6% | 48 | -15.8% | 40 | 19 | 98.6% |
| Van Nuys | $490,000 | 10.1% | 103 | -12.0% | 125 | -33.5% | 120 | 16 | 98.7% |
| Venice | $1,700,000 | 8.6% | 90 | -6.3% | 123 | 10.8% | 116 | 23 | 97.4% |
| Watts | $275,000 | 10.0% | 93 | 3.3% | 165 | -9.8% | 146 | 32 | 100.6% |
| West Adams | $525,000 | 27.1% | 42 | 7.7% | 38 | -37.7% | 44 | 14 | 102.1% |
| West Long Beach | $371,500 | 14.3% | 41 | 7.9% | 43 | -30.6% | 44 | 36 | 99.4% |
| West Los Angeles | $1,150,000 | 19.9% | 1,376 | -7.6% | 1,604 | -5.9% | 1,595 | 21 | 98.5% |
| Westwood | $850,000 | 6.3% | 97 | 1.0% | 128 | -19.0% | 113 | 35 | 96.7% |
| Woodland Hills | $669,950 | 3.1% | 211 | 6.6% | 208 | -29.0% | 212 | 22 | 96.9% |
| Los Angeles | $559,000 | 9.6% | 2,499 | 3.6% | 5,529 | -20.0% | 2,028 | 24 | 98.2% |
NOTE: Not all neighborhoods are listed, but totals for L.A. encompass entire city. Data is based on listing information and might not reflect all real estate activity in the market. Neighborhood-specific data is measured over the three months ended Dec. 31. Inventory measures listings active as of Dec. 31. Glassell Park data is skewed due to an MLS issue.
For more information, contact Redfin journalist services
Phone: 206-588-6863
Email: press@redfin.com
To be added to Redfin’s press release distribution list, please click here.
Other popular articles:


 United States
 Canada