
| Market Summary | February 2016 | Month-Over-Month | Year-Over-Year |
|---|---|---|---|
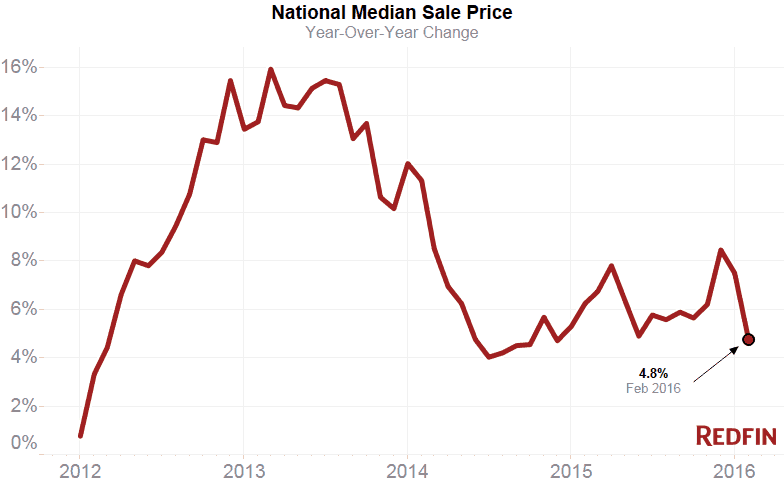
| Median sale price | $251,700 | -1.2% | 4.8% |
| Homes sold | 127,600 | 4.6% | 4.8% |
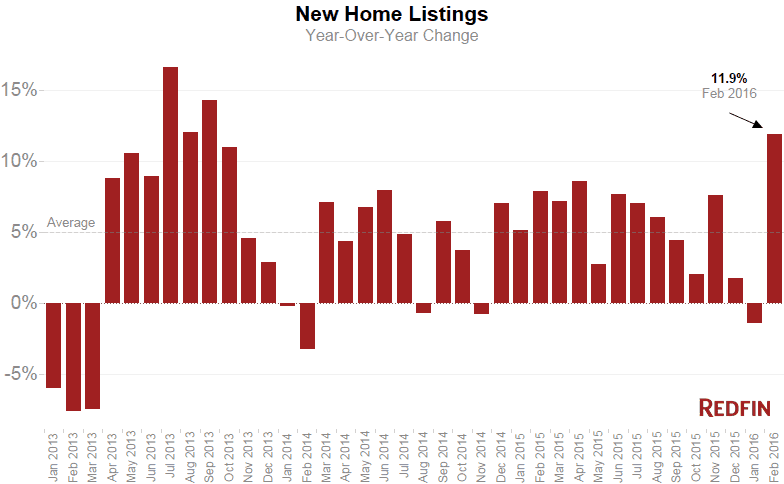
| New listings | 220,700 | 10.8% | 11.9% |
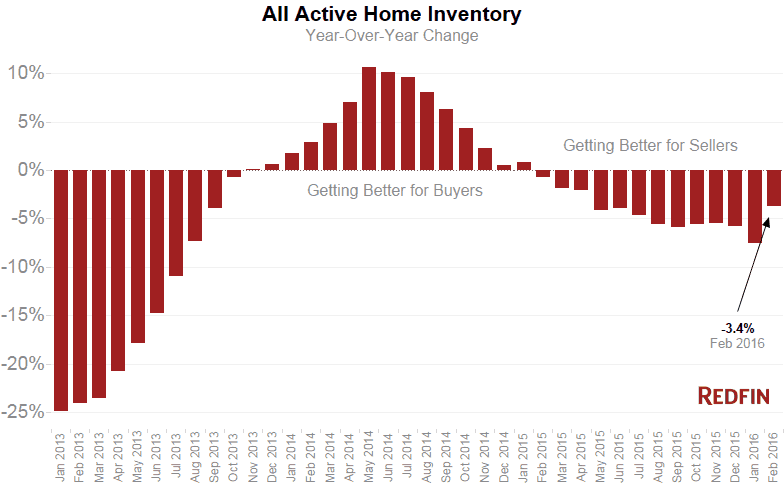
| All Homes for sale | 518,100 | 4.1% | -3.7% |
| Median days on market | 47 | 1 | -6 |
| Months of supply | 4.2 | 0 | -0.3 |
| Sold above list | 17.7% | 1.2% | 1.1% |
| Average Sale-to-list | 91.0% | -0.1% | -0.1% |
New home listings grew at the fastest rate since 2013 in February, surging 11.9 percent from last year. Overall inventory fell 3.7 percent year over year, a slower decline than in recent months but a disappointing number for homebuyers hoping for more homes to choose from as the spring selling season approaches.
Still, a big increase in new listings is a positive sign for the health of the housing market. Year over year, sales have increased nationally for 15 consecutive months now, and were up 4.8 percent in February, a lower rate than in December and January. In February, we also saw the Redfin home tour index exceed the record-high level reached in January, while the number of offers made increased by 15.9 percent since last year. Growth in the number of people touring homes has consistently outpaced growth in offers, a sign that lower inventory has constrained growth in home sales.
“New listings rebounded in a big way after getting off to a weak start at the beginning of the year,” said Redfin chief economist Nela Richardson.“There were enough new listings in February to cut the inventory deficit in half. More listings also had a side benefit of curbing the strong acceleration in prices we saw the last two months. Whew, finally a little breathing room for buyers just in time for the start of the spring buying season.”
The median sale price grew 4.8 percent to $251,727, a smaller increase than the 6.3 percent average over the past year.
The market remained slightly more competitive for homebuyers than it was a year earlier. A typical home spent 47 days on the market, down from 52 a year earlier, and 17.7 percent sold above asking price, compared with 16.7 in February 2015. There were 4.2 months of supply, down from 4.5 last year, with six months representing a market balanced between buyers and sellers.
If big increases in new listings continue into the spring, there is hope that the market will become a little more balanced in buyers’ favor this year. But from the data we’ve seen in 2016, it seems that the inventory shortages, characteristic of expensive Western regions with robust job growth, have now spread inland to metro areas that pair strong local economies with more affordably priced homes like Grand Rapids, Indianapolis, Louisville, Minneapolis and Nashville.
“The economy is now prosperous enough that people are starting to make moves, but there are three common issues holding back some of the inventory this year,” said Redfin agent Rebecca Walter in Portland, where the number of homes for sale fell 37.4 percent from last year in February. “First, there’s a wave of landlords considering selling soon, but they’re carefully weighing whether to give up their steady rental income in exchange for a high sale price. For those who decide to sell, listing a home when you have a tenant can be tricky to navigate and takes extra time. And finally, I’ve had several prospective sellers review homes comparable in value to theirs, only to realize they can’t actually afford the home they’d want to move to and decide to stay put and keep gaining equity on their current home. I still see a steady pipeline of homes making their way onto the market, and expect inventory to pick up this year.”
Other February Highlights
Prices
- The rust belt saw some of the highest price growth in the county, with the median sale price in Akron, OH growing 17.1% to $115,000, Cleveland up 16.7% to $105,000, Detroit up 14% to $114,000, and Grand Rapids up 12.9% to $140,000 over last year.
- Tampa, FL had the biggest change in median sale price, up 17.2% to $170,000.
- DC area prices declined by 2.2% compared to last year, with both single-family residences and condos/multifamily units seeing lower median sale prices.
Sales
- Providence, RI had the biggest year-over-year increase in home sales, up 28.2%, followed by Buffalo, NY up 27.3%.
- Sales fell sharply in San Jose and San Francisco, decreasing by 32.3% and 23.5% respectively. Miami (-10.7%) and West Palm Beach, FL (-14.7%) were the only other two metro regions with a double-digit percentage point drop in home sales.
Competition
- San Francisco (105.9%), San Jose (103.1%), Oakland (102.9%) and Seattle (100.2%) had the highest sale-to-list price percentages, with Seattle seeing the biggest year-over-year increase in this metric, (+2.4%)
- Seattle was the fastest market, with half of all homes selling in 12 days or less, followed by Denver at 14 days. This was the first month since April 2014 that Denver was not the fastest market.
Inventory
- For the second month in a row, Grand Rapids had the biggest drop in inventory, falling 48.8% year over year.
- Seattle had record-low inventory in February with just 3,643 homes for sale in the metro region at the end of the month, a 38.8% decline from last year.
- Seattle also had lowest months of supply in the country at 1.4, followed by Oakland (1.6), Portland, OR (1.8) and Denver (1.9).
You can download metro-level data from the February Market Tracker in an Excel Spreadsheet. and see Redfin’s data center to find out what’s happening in other regions.
For additional local analysis, see: Chicago, Los Angeles, Miami, San Francisco and Washington, D.C.
Median Sale Price
| Redfin Metro | Median Sale Price | Month-Over-Month | Year-Over-Year |
|---|---|---|---|
| Akron, OH | $115,000 | 9.5% | 17.1% |
| Albany, NY | $176,000 | 0.6% | 0.6% |
| Allentown, PA | $163,950 | -2.6% | 7.2% |
| Atlanta, GA | $190,000 | 4.4% | 5.6% |
| Austin, TX | $270,000 | 3.8% | 8.0% |
| Baltimore, MD | $225,000 | 2.7% | 2.2% |
| Boston, MA | $303,937 | -7.9% | -1.5% |
| Buffalo, NY | $119,110 | 0.9% | 8.3% |
| Charleston, SC | $237,950 | 6.5% | 8.2% |
| Charlotte, NC | $189,000 | 1.9% | 1.6% |
| Chicago, IL | $185,000 | -2.6% | 8.8% |
| Cincinnati, OH | $134,850 | 4.5% | 7.9% |
| Cleveland, OH | $105,000 | -0.9% | 16.7% |
| Columbus, OH | $159,250 | 3.4% | 6.6% |
| Dallas-Fort Worth, TX | $219,000 | 6.9% | 9.5% |
| Denver, CO | $329,000 | 3.5% | 10.8% |
| Detroit-Warren, MI | $113,950 | -6.2% | 13.9% |
| Fort Lauderdale, FL | $207,000 | 7.4% | 10.1% |
| Fresno, CA | $209,000 | -0.5% | 1.2% |
| Grand Rapids, MI | $140,000 | 1.8% | 12.9% |
| Greenville, SC | $170,000 | 0.6% | 6.2% |
| Hampton Roads, VA | $197,950 | 1.6% | -1.0% |
| Honolulu, HI | $525,000 | 1.9% | 11.3% |
| Houston, TX | $201,745 | 0.4% | 1.4% |
| Hudson Valley, NY | $375,000 | -3.8% | 0.0% |
| Indianapolis, IN | $138,000 | 2.2% | 3.0% |
| Jacksonville, FL | $168,250 | 2.0% | 4.5% |
| Las Vegas, NV | $202,562 | 1.3% | 7.2% |
| Little Rock, AR | $145,000 | 1.4% | -0.7% |
| Long Island, NY | $370,000 | -1.3% | 2.8% |
| Los Angeles, CA | $495,500 | 0.1% | 7.7% |
| Louisville, KY | $144,500 | -8.4% | -0.3% |
| Memphis, TN | $138,000 | 7.0% | -3.3% |
| Miami, FL | $242,000 | 0.8% | 13.1% |
| Minneapolis-St. Paul, MN | $205,000 | -4.6% | 3.7% |
| Nashville, TN | $229,000 | -3.8% | 10.6% |
| New Orleans, LA | $181,000 | 1.7% | 4.5% |
| North Port, FL | $224,000 | -2.6% | 11.0% |
| Oakland, CA | $553,000 | -1.2% | 10.6% |
| Omaha, NE | $160,000 | 1.5% | 7.2% |
| Orange County, CA | $585,000 | -2.3% | 3.5% |
| Orlando, FL | $185,000 | 1.2% | 12.1% |
| Philadelphia, PA | $210,000 | -4.5% | 7.7% |
| Phoenix, AZ | $216,875 | 1.3% | 8.4% |
| Portland, OR | $305,000 | 2.3% | 11.7% |
| Providence, RI | $195,000 | 1.2% | 12.1% |
| Raleigh-Durham, NC | $223,900 | 0.4% | 10.0% |
| Richmond, VA | $194,900 | -2.1% | 1.8% |
| Riverside-San Bernardino, CA | $300,000 | 1.7% | 5.3% |
| Rochester, NY | $112,950 | -2.2% | -1.8% |
| Sacramento, CA | $319,000 | 2.6% | 4.6% |
| San Antonio, TX | $190,000 | 2.7% | 1.1% |
| San Diego, CA | $468,000 | -1.5% | 6.4% |
| San Francisco, CA | $1,069,000 | 11.4% | 9.6% |
| San Jose, CA | $810,500 | 5.9% | 2.5% |
| Seattle, WA | $398,750 | -0.3% | 11.5% |
| St. Louis, MO | $150,000 | -1.0% | 3.4% |
| Tacoma, WA | $250,000 | 2.0% | 6.4% |
| Tampa, FL | $170,000 | 3.7% | 17.2% |
| Tucson, AZ | $171,500 | -0.3% | 0.9% |
| Tulsa, OK | $144,700 | 3.4% | 4.9% |
| Ventura County, CA | $523,000 | -2.2% | 7.4% |
| Washington, DC | $340,000 | -1.2% | -2.2% |
| West Palm Beach, FL | $225,000 | 2.3% | 15.4% |
| Wilmington, DE | $190,000 | -4.3% | -2.9% |
| National | $251,700 | -1.2% | 4.8% |
Homes Sold
| Redfin Metro | Homes Sold | Month-Over-Month | Year-Over-Year |
|---|---|---|---|
| Akron, OH | 516 | 2.0% | 6.6% |
| Albany, NY | 487 | -20.6% | 11.4% |
| Allentown, PA | 460 | -5.7% | 24.7% |
| Atlanta, GA | 6,389 | 17.4% | 8.1% |
| Austin, TX | 1,800 | 18.4% | -1.0% |
| Baltimore, MD | 2,271 | 5.8% | 16.3% |
| Boston, MA | 3,858 | -17.2% | 21.5% |
| Buffalo, NY | 676 | -10.2% | 27.3% |
| Charleston, SC | 1,005 | 15.8% | 9.0% |
| Charlotte, NC | 1,875 | 12.2% | 7.3% |
| Chicago, IL | 6,296 | 0.0% | 6.4% |
| Cincinnati, OH | 1,360 | 4.7% | 2.8% |
| Cleveland, OH | 1,585 | 5.0% | 16.3% |
| Columbus, OH | 1,384 | 4.5% | 2.6% |
| Dallas-Fort Worth, TX | 5,721 | 15.0% | 8.4% |
| Denver, CO | 2,944 | 4.0% | 1.4% |
| Detroit-Warren, MI | 4,296 | 2.2% | 8.8% |
| Fort Lauderdale, FL | 2,277 | -2.1% | -1.9% |
| Fresno, CA | 584 | 4.5% | 8.1% |
| Grand Rapids, MI | 667 | -2.6% | -2.8% |
| Greenville, SC | 550 | 14.8% | 4.6% |
| Hampton Roads, VA | 1,336 | 19.0% | 17.5% |
| Honolulu, HI | 550 | 2.0% | 7.0% |
| Houston, TX | 4,803 | 14.4% | 9.1% |
| Hudson Valley, NY | 857 | -1.3% | 22.8% |
| Indianapolis, IN | 1,663 | 13.8% | 0.9% |
| Jacksonville, FL | 1,547 | 12.4% | 6.0% |
| Las Vegas, NV | 2,649 | 14.0% | 9.7% |
| Little Rock, AR | 579 | 12.9% | -0.7% |
| Long Island, NY | 1,737 | -7.1% | 22.0% |
| Los Angeles, CA | 4,249 | -4.5% | 3.7% |
| Louisville, KY | 925 | 15.0% | 19.8% |
| Memphis, TN | 739 | 15.6% | 0.0% |
| Miami, FL | 2,182 | -4.2% | -10.7% |
| Minneapolis-St. Paul, MN | 2,604 | -6.7% | 1.4% |
| Nashville, TN | 2,008 | 4.5% | 20.9% |
| New Orleans, LA | 909 | 1.3% | 4.5% |
| North Port, FL | 1,319 | 6.5% | -6.3% |
| Oakland, CA | 1,446 | -12.5% | -2.4% |
| Omaha, NE | 649 | 3.3% | -1.5% |
| Orange County, CA | 1,793 | -1.8% | 3.9% |
| Orlando, FL | 2,755 | 10.7% | -5.0% |
| Philadelphia, PA | 2,726 | -6.0% | 11.5% |
| Phoenix, AZ | 5,533 | 11.2% | 0.3% |
| Portland, OR | 2,214 | -6.2% | 3.0% |
| Providence, RI | 673 | 4.2% | 28.2% |
| Raleigh-Durham, NC | 1,664 | 6.1% | 7.4% |
| Richmond, VA | 919 | 11.5% | 7.5% |
| Riverside-San Bernardino, CA | 3,418 | 0.4% | 5.2% |
| Rochester, NY | 630 | -5.0% | 18.6% |
| Sacramento, CA | 1,884 | 8.8% | -1.4% |
| San Antonio, TX | 1,758 | 19.4% | 5.0% |
| San Diego, CA | 2,150 | 6.4% | -5.6% |
| San Francisco, CA | 672 | 0.1% | -23.5% |
| San Jose, CA | 751 | -7.7% | -32.3% |
| Seattle, WA | 2,550 | 14.7% | 0.8% |
| St. Louis, MO | 1,750 | 1.2% | 0.8% |
| Tacoma, WA | 815 | -1.7% | 3.8% |
| Tampa, FL | 3,994 | 19.5% | 1.3% |
| Tucson, AZ | 990 | 8.3% | 10.9% |
| Tulsa, OK | 814 | 18.5% | 5.7% |
| Ventura County, CA | 478 | -1.4% | 3.2% |
| Washington, DC | 4,366 | 3.0% | 6.6% |
| West Palm Beach, FL | 2,028 | 3.3% | -14.7% |
| Wilmington, DE | 530 | 5.6% | 25.0% |
| National | 127,600 | 4.6% | 4.8% |
New Listings
| Redfin Metro | New Listings | Month-Over-Month | Year-Over-Year |
|---|---|---|---|
| Akron, OH | 975 | 8.2% | 10.0% |
| Albany, NY | 1,108 | 11.4% | 21.0% |
| Allentown, PA | 1,085 | 8.2% | 16.5% |
| Atlanta, GA | 8,539 | 8.2% | 6.2% |
| Austin, TX | 3,023 | 18.8% | 13.6% |
| Baltimore, MD | 3,868 | 20.8% | 9.2% |
| Boston, MA | 6,815 | 16.0% | 55.2% |
| Buffalo, NY | 1,115 | 14.8% | 21.9% |
| Charleston, SC | 1,816 | 14.1% | 13.7% |
| Chicago, IL | 16,574 | 26.0% | 18.3% |
| Cincinnati, OH | 2,712 | 16.5% | 10.6% |
| Cleveland, OH | 2,900 | 14.7% | 21.7% |
| Columbus, OH | 2,264 | 17.4% | 12.2% |
| Dallas-Fort Worth, TX | 8,995 | 10.2% | 19.3% |
| Denver, CO | 4,097 | 11.7% | 3.1% |
| Detroit-Warren, MI | 7,067 | -3.6% | 11.8% |
| Fresno, CA | 836 | -6.0% | -6.7% |
| Grand Rapids, MI | 1,031 | 17.3% | 8.8% |
| Greenville, SC | 902 | 16.4% | 3.1% |
| Hampton Roads, VA | 2,878 | 1.4% | 27.6% |
| Honolulu, HI | 1,081 | 6.7% | 6.5% |
| Houston, TX | 10,108 | 6.8% | 20.2% |
| Hudson Valley, NY | 1,906 | 20.2% | 29.6% |
| Indianapolis, IN | 2,979 | 18.0% | -0.1% |
| Jacksonville, FL | 2,728 | 4.7% | 8.8% |
| Las Vegas, NV | 4,501 | -1.5% | 9.2% |
| Little Rock, AR | 1,312 | 5.8% | 13.7% |
| Long Island, NY | 3,270 | -3.3% | 18.1% |
| Los Angeles, CA | 8,864 | 6.9% | 12.3% |
| Louisville, KY | 1,417 | 9.7% | 8.3% |
| Memphis, TN | 1,365 | 16.6% | 16.6% |
| Minneapolis-St. Paul, MN | 5,705 | 40.1% | 1.6% |
| Nashville, TN | 3,726 | 13.1% | 26.3% |
| New Orleans, LA | 1,737 | 5.8% | 19.7% |
| North Port, FL | 2,795 | -0.6% | 16.0% |
| Oakland, CA | 2,518 | 30.3% | -1.4% |
| Omaha, NE | 1,199 | 7.0% | 2.1% |
| Orange County, CA | 3,728 | 18.3% | 17.2% |
| Orlando, FL | 4,560 | 3.9% | 1.2% |
| Philadelphia, PA | 5,583 | 19.2% | 5.0% |
| Phoenix, AZ | 10,058 | -0.9% | 13.1% |
| Portland, OR | 3,559 | 14.0% | -0.5% |
| Providence, RI | 1,147 | -1.5% | 26.7% |
| Raleigh-Durham, NC | 2,833 | 17.8% | 15.0% |
| Richmond, VA | 1,827 | 5.2% | 12.2% |
| Riverside-San Bernardino, CA | 7,423 | 4.0% | 17.6% |
| Rochester, NY | 1,372 | 6.7% | 24.2% |
| San Antonio, TX | 3,022 | 8.7% | 12.8% |
| San Diego, CA | 4,162 | 3.6% | 4.1% |
| San Francisco, CA | 1,309 | 26.1% | -7.0% |
| San Jose, CA | 1,457 | 37.8% | 2.2% |
| Seattle, WA | 3,783 | 15.1% | -4.9% |
| St. Louis, MO | 3,593 | 18.4% | 8.8% |
| Tacoma, WA | 1,258 | 15.8% | 4.0% |
| Tampa, FL | 6,537 | 4.7% | 7.9% |
| Tucson, AZ | 1,853 | -12.1% | 1.7% |
| Tulsa, OK | 1,733 | 19.9% | 13.9% |
| Ventura County, CA | 922 | 6.3% | 0.4% |
| Washington, DC | 7,798 | 28.7% | 3.3% |
| West Palm Beach, FL | 4,481 | -2.9% | 11.1% |
| Wilmington, DE | 908 | 4.8% | 3.8% |
| National | 220,700 | 10.8% | 11.9% |
All Homes for Sale
| Redfin Metro | All Homes for Sale | Month-Over-Month | Year-Over-Year |
|---|---|---|---|
| Akron, OH | 3,105 | 0.8% | -7.9% |
| Albany, NY | 4,076 | -3.3% | -9.4% |
| Allentown, PA | 4,519 | 1.5% | -1.2% |
| Atlanta, GA | 19,335 | -5.3% | -13.6% |
| Austin, TX | 5,028 | 2.4% | 0.6% |
| Baltimore, MD | 10,605 | -5.3% | -11.6% |
| Boston, MA | 15,735 | -1.6% | -2.2% |
| Buffalo, NY | 5,086 | -3.1% | -24.7% |
| Charleston, SC | 6,166 | 5.6% | -2.3% |
| Chicago, IL | 41,775 | 16.0% | 9.9% |
| Cincinnati, OH | 9,240 | 7.3% | 0.1% |
| Cleveland, OH | 9,874 | 1.8% | -4.7% |
| Columbus, OH | 6,086 | 21.1% | 9.9% |
| Dallas-Fort Worth, TX | 14,016 | 4.6% | 2.9% |
| Denver, CO | 5,636 | 14.4% | 35.4% |
| Detroit-Warren, MI | 15,724 | -8.4% | -8.4% |
| Fresno, CA | 1,737 | -9.6% | -14.4% |
| Grand Rapids, MI | 2,066 | -7.3% | -48.8% |
| Greenville, SC | 2,984 | 13.1% | 2.0% |
| Hampton Roads, VA | 8,436 | 0.4% | -4.5% |
| Honolulu, HI | 3,515 | 6.9% | -0.7% |
| Houston, TX | 22,349 | 1.6% | 25.5% |
| Hudson Valley, NY | 8,354 | 17.3% | 33.7% |
| Indianapolis, IN | 8,165 | -3.2% | -31.1% |
| Jacksonville, FL | 7,422 | 0.5% | -13.1% |
| Las Vegas, NV | 14,566 | 3.8% | -2.5% |
| Little Rock, AR | 4,294 | 9.2% | -4.0% |
| Long Island, NY | 12,950 | 0.3% | -7.9% |
| Los Angeles, CA | 15,289 | 9.8% | -0.7% |
| Louisville, KY | 3,210 | -4.7% | -38.6% |
| Memphis, TN | 4,194 | 5.2% | -3.7% |
| Minneapolis-St. Paul, MN | 10,928 | 6.2% | -16.1% |
| Nashville, TN | 8,000 | 3.7% | -8.8% |
| North Port, FL | 8,026 | 10.7% | 11.1% |
| Oakland, CA | 2,271 | 12.9% | -14.1% |
| Omaha, NE | 2,116 | -3.2% | -17.9% |
| Orange County, CA | 6,864 | 23.1% | 19.2% |
| Orlando, FL | 11,873 | -0.8% | -14.5% |
| Philadelphia, PA | 17,947 | 0.5% | -9.9% |
| Phoenix, AZ | 23,855 | 11.1% | 5.0% |
| Portland, OR | 4,072 | -6.9% | -37.4% |
| Providence, RI | 3,722 | -4.7% | -0.4% |
| Raleigh-Durham, NC | 7,538 | 15.6% | 7.8% |
| Richmond, VA | 3,905 | -3.3% | -15.6% |
| Riverside-San Bernardino, CA | 17,883 | 8.5% | 13.6% |
| San Antonio, TX | 7,066 | 1.1% | 10.0% |
| San Diego, CA | 5,984 | 0.7% | -15.6% |
| San Francisco, CA | 1,828 | 19.9% | 0.1% |
| San Jose, CA | 1,936 | 23.2% | -3.0% |
| Seattle, WA | 3,643 | -4.6% | -38.8% |
| St. Louis, MO | 9,085 | 2.8% | -11.2% |
| Tacoma, WA | 1,875 | -12.5% | -39.8% |
| Tampa, FL | 16,261 | 5.0% | -10.1% |
| Tucson, AZ | 5,776 | 13.4% | 3.0% |
| Tulsa, OK | 5,771 | 1.9% | -1.5% |
| Ventura County, CA | 1,515 | 2.2% | -10.9% |
| Washington, DC | 15,180 | -2.7% | -8.6% |
| West Palm Beach, FL | 14,191 | 11.4% | 12.8% |
| Wilmington, DE | 3,429 | -0.5% | -4.5% |
| National | 518,100 | 4.1% | -3.7% |
For more information, contact Redfin journalist services
Phone: 206-588-6863
Email: press@redfin.com
To be added to Redfin’s press release distribution list, subscribe here.


