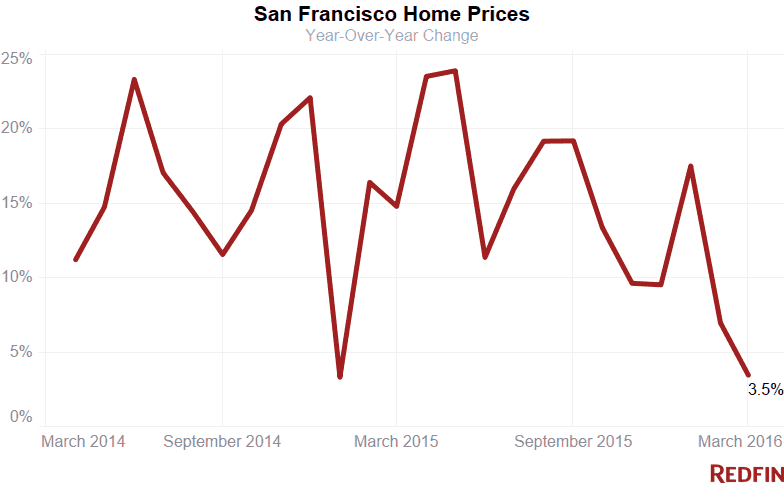
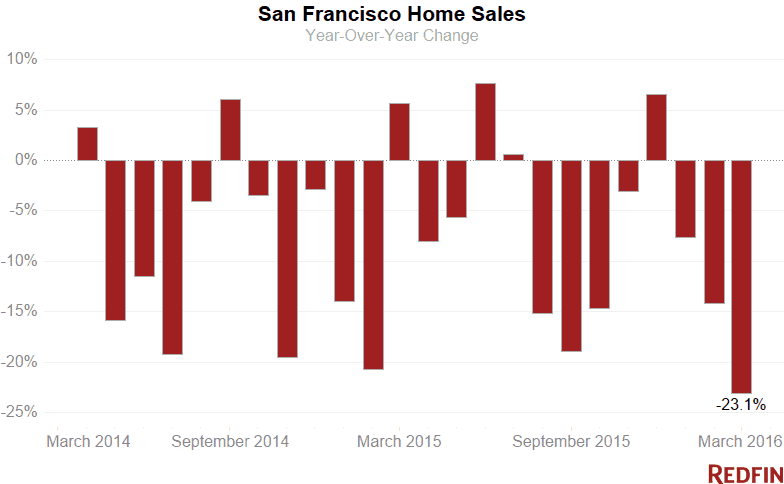
San Francisco home prices rose 3.5 percent in March from a year earlier to a median $1.2 million, the smallest year-over-year increase in more than a year. Sales in the city tumbled more than 23 percent.
It was the third-straight sales drop and the steepest in at least six years as buyer burnout exacerbated the city’s ongoing supply shortage.
While the supply of homes for sale in the city has been increasing since September, there still aren’t enough sellers to meet buyer demand. The number of houses on the market increased nearly 32 percent in March compared to a year earlier, but supply fell to about six weeks, well below the six months that signals a balance of power between buyers and sellers.
“The lack of sales is not buyers saying forget it, it’s owners who don’t want to sell and become buyers in this market,” Redfin agent Mark Colwell said. “So we have primarily a supply problem, but there’s also fatigue from buyers who see prices approaching a ceiling and have less appetite for pushing the envelope.”
Despite the city’s rapid price escalation, values haven’t peaked yet, Colwell said.
“We’re probably in the seventh inning,” he said. “Multiple-offer situations are still not only prevalent but the norm in most neighborhoods. I would call it a normalization.”
Bay Area
For homes across the greater Bay Area, the median sale price fell 1.8 percent year over year to $1.04 million, the first price drop in four years. Sales plunged more than 22 percent compared to March 2015 and now have fallen 21 of the last 22 months.
Hot Neighborhoods
Pacific Heights held on to top billing as the city’s most expensive community, with a median sale price of almost $2.14 million. In Russian Hill, a typical home fetched $2.02 million, making it the city’s second priciest neighborhood.
Prices in the Tenderloin remained low, at $507,000, making it the city’s least-expensive neighborhood. Merced Heights (at $644,200) and Bayview ($670,000) followed.
Buyers had fewer choices in some of those more affordable communities, including Twin Peaks, Visitacion Valley, Portola and Forest Hill. Across the rest of the city, however, inventory increased, giving buyers slightly more leverage. In the Tenderloin, Civic Center/Van Ness and Mission Bay, inventory more than doubled in March from a year ago.
See our city page for the most up-to-date data on San Francisco home prices.
Here’s what’s happening in your neighborhood:
| Place | Median Sale Price | Year-Over-Year | Homes Sold | Year-Over-Year | Inventory | Year-Over-Year | New Listings | Median Days on Market | Avg Sale-to-List |
|---|---|---|---|---|---|---|---|---|---|
| Ashbury Heights | $1,350,000 | -18.0% | 11 | -8.3% | 3 | 0.0% | 10 | 18 | 112.7% |
| Bayview | $670,000 | -4.3% | 22 | -29.0% | 16 | -20.0% | 32 | 18 | 105.5% |
| Bernal Heights | $1,410,000 | 22.2% | 29 | -46.3% | 19 | 18.8% | 51 | 14 | 114.0% |
| Castro | $1,201,000 | 25.0% | 1 | -50.0% | 1 | NA | 2 | 9 | 109.4% |
| Civic Center / Van Ness | $922,500 | 8.3% | 16 | 0.0% | 17 | 183.3% | 47 | 14 | 104.8% |
| Crocker Amazon | $836,250 | 8.2% | 12 | 20.0% | 7 | 75.0% | 12 | 21 | 106.9% |
| Daly City | $755,000 | 4.4% | 56 | 51.3% | 58 | 9.4% | 43 | 19 | 106.7% |
| Excelsior | $910,000 | 29.5% | 7 | -68.2% | 10 | 25.0% | 21 | 15 | 112.6% |
| Financial District | $843,750 | -56.7% | 2 | -77.8% | 7 | 75.0% | 10 | 14.5 | 101.5% |
| Forest Hill | $1,400,000 | -3.4% | 3 | -40.0% | 2 | -50.0% | 6 | 38 | 109.3% |
| Haight Ashbury | $1,042,500 | -13.5% | 7 | -30.0% | 3 | 200.0% | 10 | 26 | 105.2% |
| Hayes Valley | $1,400,000 | 7.3% | 5 | -37.5% | 9 | 800.0% | 14 | 16.5 | 113.1% |
| Ingleside | $870,000 | 2.3% | 5 | -28.6% | 6 | 200.0% | 7 | 84 | 116.9% |
| Inner Richmond | $1,550,050 | -11.4% | 16 | -15.8% | 9 | -40.0% | 26 | 15.5 | 112.9% |
| Inner Sunset | $1,555,000 | 28.9% | 18 | 0.0% | 5 | -16.7% | 26 | 17 | 113.0% |
| Lower Haight | $1,360,000 | 23.6% | 11 | -26.7% | 7 | 16.7% | 20 | 13 | 113.4% |
| Merced Heights | $644,215.5 | 0.7% | 12 | 0.0% | 5 | -28.6% | 18 | 13 | 114.2% |
| Miraloma Park | $1,525,000 | 31.2% | 17 | -29.2% | 10 | 11.1% | 28 | 13 | 115.2% |
| Mission | $1,174,500 | 16.3% | 36 | -50.7% | 25 | -7.4% | 46 | 27 | 106.8% |
| Mission Bay | $1,345,000 | 37.5% | 33 | 83.3% | 26 | 188.9% | 62 | 16 | 101.8% |
| Nob Hill | $1,200,000 | -25.8% | 15 | -16.7% | 11 | 0.0% | 25 | 19 | 100.6% |
| Noe Valley | $1,825,000 | 23.7% | 35 | -34.0% | 20 | 33.3% | 70 | 18 | 109.0% |
| Outer Mission | $860,000 | 10.5% | 5 | -64.3% | 5 | 25.0% | 8 | 19 | 109.8% |
| Outer Richmond | $1,000,000 | -3.4% | 15 | 7.1% | 8 | 0.0% | 28 | 22 | 113.4% |
| Outer Sunset | $1,035,000 | 11.0% | 27 | 3.8% | 15 | 0.0% | 43 | 14 | 120.7% |
| Pacific Heights | $2,137,500 | 7.5% | 34 | -20.9% | 35 | 169.2% | 73 | 14 | 104.8% |
| Pacific Heights | $923,000 | 13.2% | 3 | -40.0% | 2 | NA | 3 | 59 | 106.9% |
| Parkside | $1,168,000 | 19.2% | 13 | 0.0% | 10 | 25.0% | 29 | 13 | 121.5% |
| Portola | $848,000 | 22.9% | 11 | 10.0% | 5 | -50.0% | 16 | 26 | 103.0% |
| Potrero Hill | $1,133,500 | -19.0% | 48 | 65.5% | 16 | 45.5% | 64 | 17 | 107.8% |
| Rincon Hill | $1,197,500 | -0.1% | 22 | -18.5% | 25 | 108.3% | 48 | 14.5 | 101.2% |
| Russian Hill | $2,025,500 | 72.0% | 20 | 0.0% | 15 | 66.7% | 37 | 12 | 105.9% |
| South of Market | $968,000 | -7.8% | 75 | -5.1% | 67 | 55.8% | 135 | 15 | 102.7% |
| South San Francisco | $830,000 | 12.2% | 36 | 9.1% | 46 | 48.4% | 40 | 19 | 107.1% |
| Sunnyside | $1,290,000 | 29.0% | 14 | 27.3% | 6 | 0.0% | 23 | 12 | 119.8% |
| Sunset District | $1,205,000 | 9.6% | 91 | 0.0% | 42 | 0.0% | 147 | 15 | 118.6% |
| Telegraph Hill | $973,000 | -44.0% | 12 | 20.0% | 9 | 12.5% | 22 | 13 | 105.1% |
| Tenderloin | $507,500 | 6.3% | 6 | 200.0% | 6 | 500.0% | 10 | 24 | 101.8% |
| Twin Peaks | $1,193,000 | 11.5% | 7 | 16.7% | 1 | -83.3% | 6 | 21 | 104.7% |
| Visitacion Valley | $725,000 | 4.3% | 7 | -58.8% | 3 | -80.0% | 10 | 14 | 108.6% |
| Western Addition | $1,155,000 | 44.4% | 16 | 0.0% | 10 | 150.0% | 20 | 18 | 104.8% |
| San Francisco | $1,200,000 | 3.4% | 390 | -23.1% | 650 | 31.9% | 605 | 14 | 110.0% |
NOTE: Not all neighborhoods are listed, but totals for San Francisco encompass entire city. Data is based on listing information and might not reflect all real estate activity in the market. Neighborhood-specific data is measured over a three-month span that ended March 31. Inventory measures listings active as of March 31.
For more information, contact Redfin journalist services
Phone: 206-588-6863
Email: press@redfin.com
See Redfin’s data center to find out what’s happening in other cities.
To be added to Redfin’s press release distribution list, subscribe here.


 United States
 Canada