
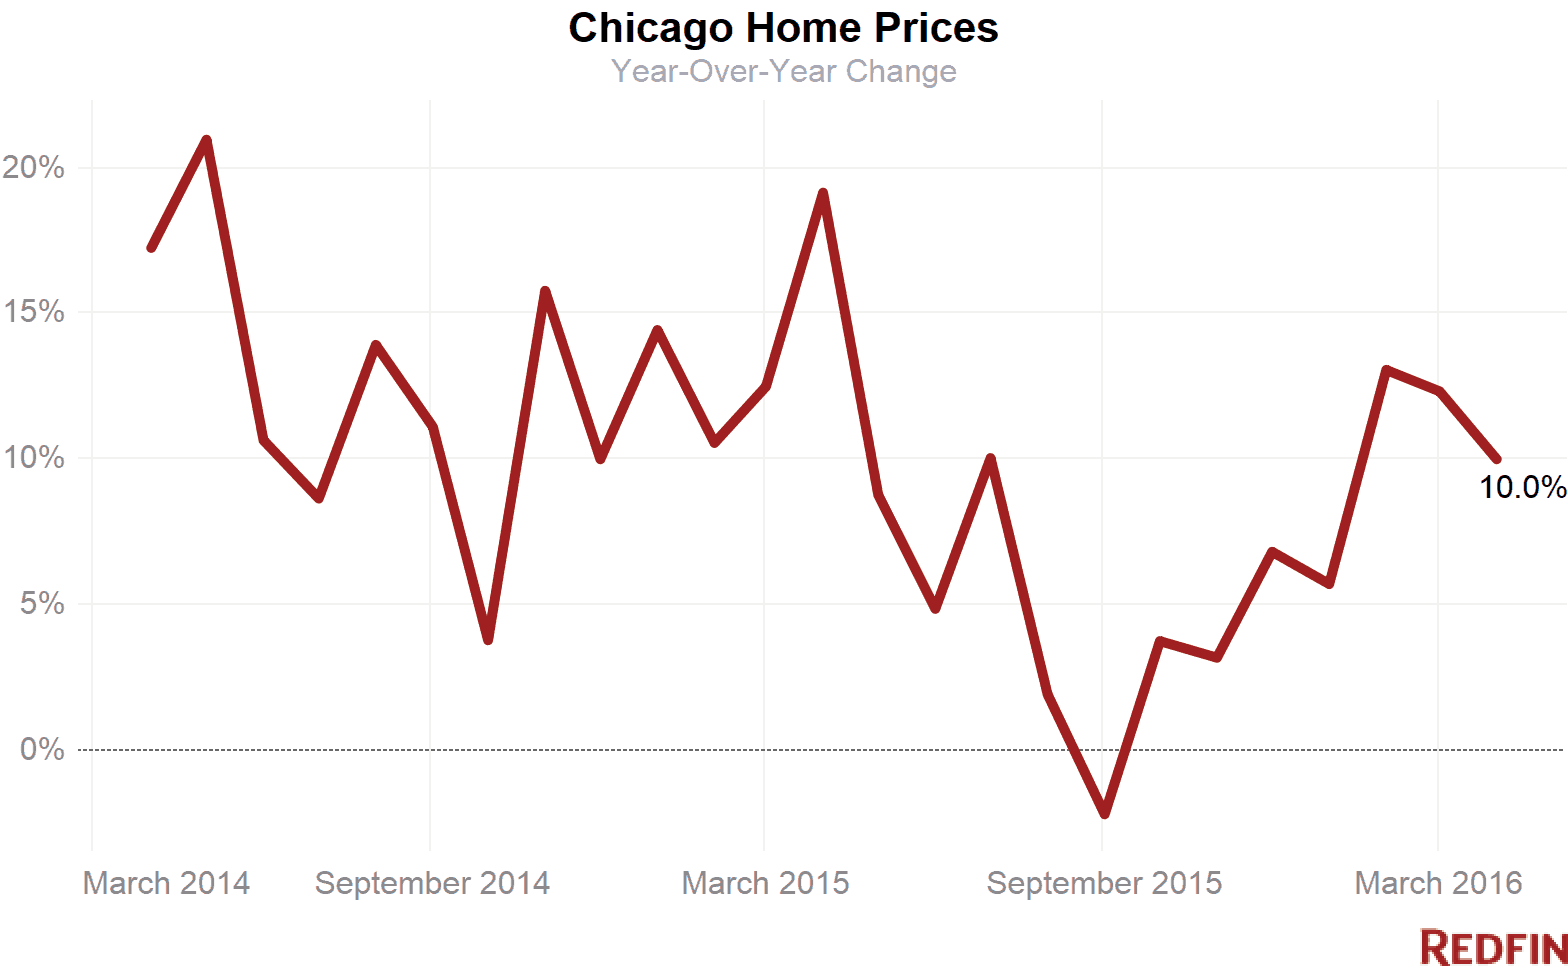
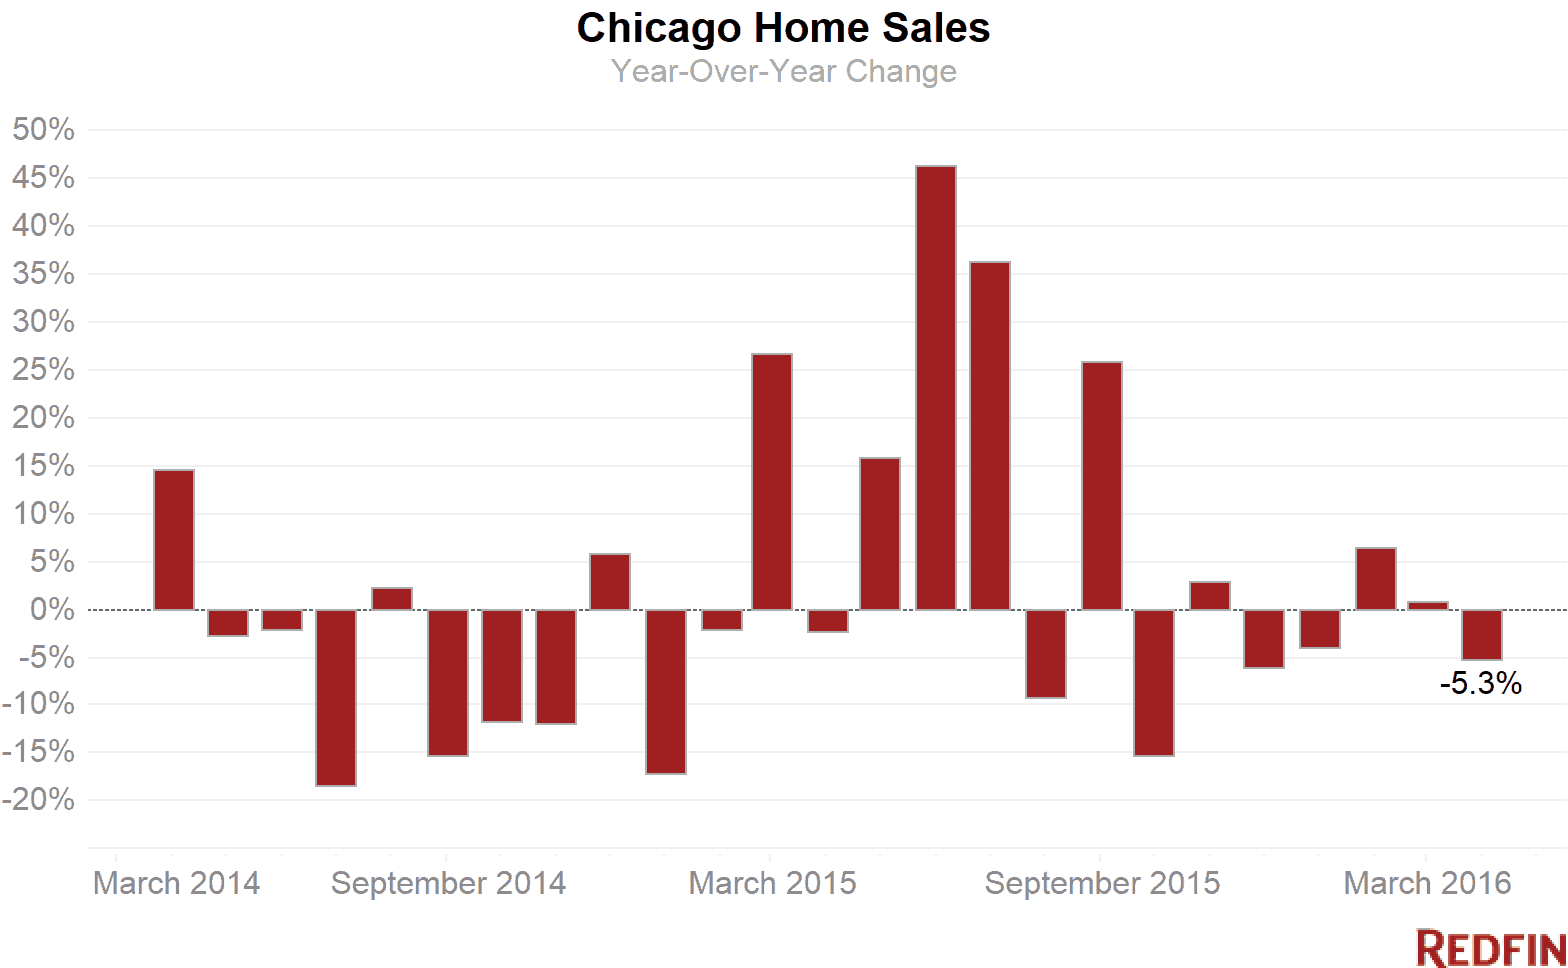
Chicago home prices rose 10 percent in April to their highest since at least 2010, with the typical property selling for $280,000. As prices jumped, sales reversed course, falling nearly 5.3 percent from a year earlier.
The supply of homes for sale tumbled 12.3 percent compared to a year earlier, the eighth-straight drop and the biggest decrease in more than two years. Fewer sellers put their houses on the market, pushing new listings down more than 18 percent from the same time last year.
Supply grew particularly tight in Montclare, where inventory was down more than 56 percent compared to a year ago. The inventory of houses for sale also shrunk dramatically in Tri-Taylor, down 48 percent, and Washington Park, down nearly 38 percent.
“I’ve been kicking off consultations with new homebuyers by explaining that supply is tight, which means the most desirable homes sell within days in a bidding war more often than not,” Redfin agent Lamar Austin said.
“For competition-averse clients, I highlight homes that have been on the market for at least 30 to 60 days. These tend to be the ones that other buyers have passed on because don’t have the clearest listing photos or modern finishes,” Austin said. “Most new homeowners would rather spend some money upgrading a home to make it their own than feel like they overpaid in a bidding war.”
Hot Neighborhoods
Ukrainian Village, this year’s hottest neighborhood, was the most expensive in the city, with a typical home selling for $577,450. North Center was a distant second at $465,000. Bucktown ($459,950), Roscoe Village ($449,900), and Lincoln Park ($448,858) rounded out the top five.
In Pullman and South Shore, two of the city’s most affordable neighborhoods, and McKinley Park, median sale prices jumped more than 50 percent.
See our city page for the most up-to-date data on Chicago home prices.
Here’s what’s happening in your neighborhood:
| Place | Median Sale Price | Year-Over-Year | Homes Sold | Year-Over-Year | Inventory | Year-Over-Year | New Listings | Median Days on Market | Avg Sale-to-List |
|---|---|---|---|---|---|---|---|---|---|
| Albany Park | $246,500 | 0.6% | 94 | 19.0% | 148 | -17.3% | 177 | 94 | 96.6% |
| Andersonville | $355,000 | 10.1% | 34 | 21.4% | 67 | -1.5% | 83 | 60 | 96.9% |
| Archer Heights | $212,500 | 40.5% | 15 | -25.0% | 28 | 21.7% | 27 | 99 | 94.4% |
| Austin | $83,000 | 10.7% | 92 | -25.2% | 156 | -17.0% | 137 | 59 | 103.1% |
| Avondale | $290,000 | -4.1% | 69 | -19.8% | 112 | -8.2% | 156 | 75 | 98.9% |
| Beverly | $240,000 | 4.5% | 54 | 58.8% | 109 | 4.8% | 90 | 145 | 97.5% |
| Bridgeport | $364,440 | 42.9% | 37 | 0.0% | 79 | -16.8% | 67 | 74 | 98.6% |
| Brighton Park | $158,000 | 14.5% | 32 | -25.6% | 53 | -20.9% | 60 | 79 | 101.8% |
| Bucktown | $459,950 | -2.7% | 84 | -2.3% | 101 | -18.6% | 148 | 58 | 98.0% |
| Clearing | $160,500 | 11.8% | 61 | -6.2% | 103 | 1.0% | 108 | 75 | 97.8% |
| Edgewater | $213,500 | 25.2% | 202 | 20.2% | 295 | -21.8% | 364 | 84 | 96.8% |
| Edison Park | $305,000 | 7.7% | 37 | 15.6% | 61 | 10.9% | 74 | 97 | 95.9% |
| Englewood | $21,500 | 26.5% | 50 | -35.1% | 203 | -15.8% | 129 | 55 | 93.9% |
| Evanston | $308,500 | 4.8% | 106 | 0.9% | 422 | -17.9% | 154 | 64 | 97.3% |
| Garfield Ridge | $198,000 | 7.0% | 76 | -12.6% | 141 | -2.8% | 142 | 79 | 97.9% |
| Gold Coast | $402,500 | 37.6% | 117 | 12.5% | 262 | -14.9% | 237 | 95 | 95.0% |
| Humboldt Park | $275,000 | 14.6% | 140 | 3.7% | 170 | -15.8% | 227 | 52 | 99.0% |
| Hyde Park | $215,000 | 8.3% | 45 | 0.0% | 121 | -25.3% | 108 | 66 | 95.2% |
| Irving Park | $266,750 | -3.2% | 138 | 12.2% | 193 | -16.4% | 220 | 89 | 96.8% |
| Jefferson Park | $276,250 | -1.0% | 76 | 13.4% | 132 | 3.1% | 149 | 63 | 97.5% |
| Joliet | $156,000 | 16.2% | 232 | 4.5% | 676 | -30.3% | 305 | 72 | 98.1% |
| Kenwood | $157,500 | 6.8% | 32 | -20.0% | 97 | -6.7% | 87 | 111 | 97.2% |
| Lakeview | $380,750 | 3.8% | 498 | 5.1% | 722 | -17.8% | 955 | 66 | 98.0% |
| Lakeview / Wrigleyville | $381,000 | 3.5% | 501 | 5.5% | 725 | -17.6% | 960 | 66 | 98.0% |
| Lincoln Park | $448,858 | 3.8% | 148 | 0.0% | 289 | 7.0% | 351 | 58 | 97.2% |
| Lincoln Square | $385,750 | 7.1% | 46 | -16.4% | 121 | 7.1% | 122 | 112 | 97.2% |
| Logan Square | $422,500 | 24.3% | 174 | 5.4% | 189 | -8.2% | 290 | 58 | 100.1% |
| McKinley Park | $236,000 | 50.3% | 19 | 5.6% | 33 | -28.3% | 30 | 32 | 98.6% |
| Montclare | $182,000 | -11.5% | 24 | -14.3% | 26 | -56.7% | 28 | 108 | 98.3% |
| Mount Greenwood | $227,500 | 49.4% | 48 | 9.1% | 75 | 33.9% | 79 | 69 | 98.2% |
| Naperville | $365,750 | 2.7% | 277 | 18.4% | 1,293 | -0.8% | 481 | 77 | 97.0% |
| Near North Side | $405,000 | 0.0% | 620 | 7.6% | 1,111 | -10.6% | 1,253 | 72 | 97.6% |
| North Center | $465,000 | 10.7% | 61 | -24.7% | 113 | -24.2% | 135 | 76 | 97.3% |
| Oakland | $270,000 | 12.5% | 11 | -31.2% | 25 | -21.9% | 25 | 141 | 95.2% |
| Old Town | $335,000 | -8.0% | 83 | 13.7% | 113 | -11.7% | 164 | 63 | 98.3% |
| Portage Park | $266,250 | 6.5% | 134 | 12.6% | 186 | -16.2% | 225 | 110 | 98.6% |
| Pullman | $52,000 | 51.8% | 12 | -25.0% | 21 | -27.6% | 19 | 79 | 101.4% |
| Ravenswood | $334,000 | -3.8% | 58 | -19.4% | 107 | -10.1% | 151 | 49 | 97.7% |
| River North | $415,204 | 2.5% | 223 | 22.5% | 304 | -8.7% | 400 | 54 | 99.3% |
| Rogers Park | $181,545 | 12.6% | 120 | 15.4% | 205 | -13.5% | 189 | 87 | 97.1% |
| Roscoe Village | $449,900 | -11.8% | 117 | 56.0% | 123 | -12.8% | 175 | 69 | 98.7% |
| Sauganash | $399,500 | 2.4% | 34 | 100.0% | 71 | 4.4% | 80 | 114 | 95.4% |
| South Lawndale / Little Village | $90,000 | 21.6% | 25 | -32.4% | 50 | -26.5% | 44 | 49 | 99.1% |
| South Loop | $327,000 | -4.5% | 312 | 42.5% | 373 | -20.6% | 498 | 66 | 100.2% |
| South Shore | $60,000 | 56.9% | 83 | 9.2% | 154 | -6.7% | 112 | 100 | 99.0% |
| Streeterville | $415,000 | -3.9% | 145 | -5.2% | 323 | -15.7% | 330 | 104 | 96.4% |
| The Loop | $366,000 | -4.9% | 151 | 15.3% | 300 | -2.3% | 391 | 67 | 98.6% |
| Tri-taylor | $184,950 | -29.7% | 16 | -5.9% | 14 | -48.1% | 16 | 81 | 98.1% |
| Ukrainian Village | $577,450 | 16.7% | 34 | 36.0% | 46 | 0.0% | 69 | 63 | 97.5% |
| Uptown | $253,700 | 5.7% | 193 | -0.5% | 291 | -18.7% | 404 | 65 | 97.0% |
| Washington Park | $39,000 | -8.1% | 9 | -67.9% | 23 | -37.8% | 19 | 77 | 92.0% |
| West Loop | $387,500 | 6.6% | 175 | -15.9% | 196 | 1.0% | 363 | 42 | 101.0% |
| West Town | $445,000 | 4.7% | 417 | 6.1% | 491 | -10.1% | 741 | 56 | 99.1% |
| Wicker Park | $439,250 | 1.1% | 95 | -20.8% | 124 | -5.3% | 188 | 48 | 98.6% |
| Chicago, IL | $280,500 | 10.0% | 2,714 | -5.3% | 11,453 | -12.3% | 4,135 | 58 | 98.4% |
NOTE: Not all neighborhoods are listed, but totals for Chicago encompass entire city. Data is based on listing information and might not reflect all real estate activity in the market. Neighborhood-specific data is measured over a three-month span that ended April 30. Inventory measures listings active as of April 30.
For more information, contact Redfin journalist services:
Phone: 206-588-6863
Email: press@redfin.com
See Redfin’s data center to find out what’s happening in other cities.
To be added to Redfin’s press release distribution list, please click here.


