
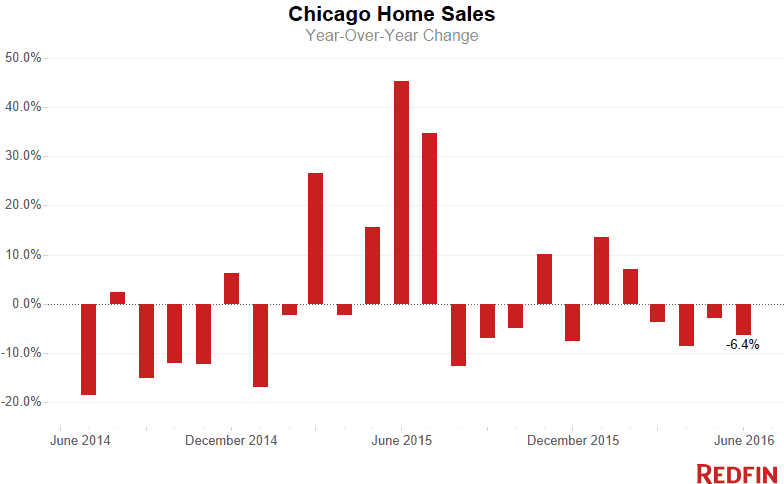
Chicago home prices increased 3.6 percent in June, as compared to last year, with a typical home selling for $285,000. The number of sales was down 6.2 percent, most likely because of a lack of options for potential homebuyers.
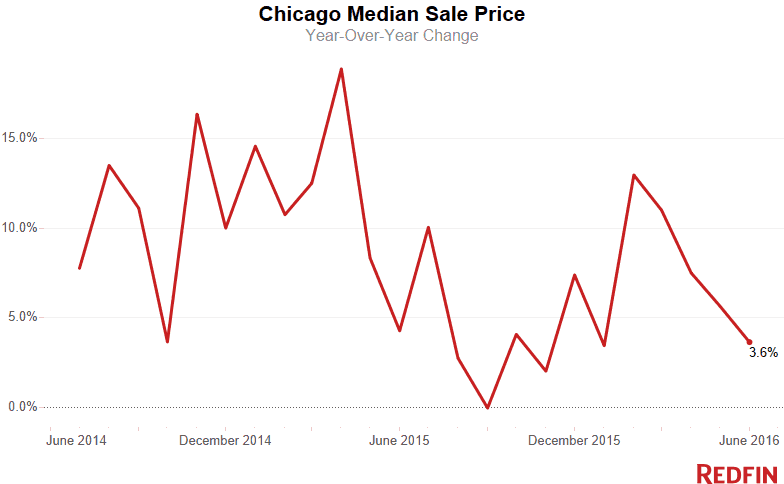
“In many areas of Chicago, prices have recovered from the bust, but buyers are much more cautious than a decade ago and spending more carefully,” said Redfin real estate agent Sarah Ziehr. “That’s holding down excessive price gains, despite competition on limited selection.”’
The number of new listings to hit the market plummeted 14.1 percent year over year in June, the third consecutive month of double-digit drops. The number of total homes for sale was also down significantly, at 12.3 percent, marking the tenth consecutive month of declines.
Twenty-seven percent of homes sold for more than list price in June, and the typical home took 55 days to sell, the shortest time recorded since the summer of 2014.
Hot Neighborhoods
South Side neighborhoods held the top six spots for price appreciation. South Shore, Brighton Park and Washington Park were the top three, each showing price gains well over 50 percent as compared to a year earlier. The next three, Pullman, Kenwood and McKinley Park, each had gains of approximately 35 percent.
North Center was the most expensive neighborhood, with a typical residence selling for $475,000. Lincoln Park was the second-most expensive, with a typical home selling for $471,250. Lincoln Parkers asked the most for their homes, with the median asking price of $550,000.
When looking at price per square foot, the top six priciest neighborhoods are all located in and around the Loop, with River North real estate costing a typical buyer $377.28 per square foot, the most expensive.
Humboldt Park had the fastest market time, with a typical home selling in 39 days. Redfin agent David Smith says that The 606 is still is a draw, as is the park itself. However, he notes that such a fast market time may be an anomaly, since many of his clients find the lack of transit options challenging — and often end up looking elsewhere, in neighborhoods like Logan Square or the West Town area.
See our city page for the most up-to-date data on Chicago home prices.
Here’s what’s happening in your neighborhood:
| Place | Median Sale Price | Year-Over-Year | Homes Sold | Year-Over-Year | Inventory | Year-Over-Year | New Listings | Median Days on Market | Avg Sale-to-List |
|---|---|---|---|---|---|---|---|---|---|
| Albany Park | $231,000 | -11.7% | 116 | -10.1% | 169 | -17.2% | 167 | 64 | 98.1% |
| Andersonville | $385,000 | 1.1% | 79 | 4.0% | 64 | -22.9% | 73 | 48 | 98.2% |
| Archer Heights | $174,900 | 2.9% | 25 | 4.2% | 31 | -6.1% | 28 | 56 | 95.6% |
| Austin | $95,000 | 12.4% | 83 | -44.7% | 170 | -19.4% | 110 | 61 | 101.3% |
| Avondale | $310,000 | -5.8% | 93 | -14.7% | 130 | -7.8% | 124 | 52 | 99.3% |
| Beverly | $263,250 | -14.0% | 64 | 4.9% | 144 | 24.1% | 111 | 87 | 96.5% |
| Bridgeport | $360,000 | 20.0% | 45 | -8.2% | 86 | -14.0% | 63 | 85 | 96.5% |
| Brighton Park | $211,000 | 68.8% | 29 | -23.7% | 46 | -38.7% | 38 | 49 | 100.4% |
| Bucktown | $460,250 | -1.0% | 132 | -5.7% | 111 | -11.9% | 158 | 42 | 99.0% |
| Clearing | $199,000 | 22.1% | 83 | 2.5% | 103 | -1.0% | 100 | 64 | 96.5% |
| Edgewater | $215,000 | 0.4% | 313 | 5.7% | 251 | -36.6% | 289 | 57 | 97.5% |
| Edison Park | $331,000 | -3.3% | 56 | 0.0% | 60 | 5.3% | 62 | 62 | 95.9% |
| Englewood | $16,800 | -18.1% | 31 | -58.1% | 173 | -15.2% | 66 | 55 | 102.2% |
| Evanston | $356,375 | 3.3% | 178 | 1.7% | 392 | -28.1% | 122 | 70 | 97.4% |
| Garfield Ridge | $207,700 | 8.2% | 128 | 14.3% | 136 | -17.1% | 152 | 74 | 97.6% |
| Gold Coast | $450,000 | 28.6% | 167 | -7.7% | 278 | -5.1% | 240 | 76 | 96.8% |
| Humboldt Park | $283,500 | 26.0% | 130 | -24.4% | 150 | -13.8% | 143 | 39 | 99.6% |
| Hyde Park | $215,000 | -6.5% | 85 | -2.3% | 107 | -27.2% | 107 | 74 | 95.1% |
| Irving Park | $277,000 | -14.3% | 182 | 0.0% | 213 | -13.8% | 211 | 58 | 97.7% |
| Jefferson Park | $285,000 | 7.1% | 105 | 19.3% | 132 | -5.7% | 126 | 52 | 98.1% |
| Joliet | $164,250 | 17.5% | 411 | 86.8% | 686 | -28.0% | 293 | 60 | 98.1% |
| Kenwood | $236,250 | 35.0% | 52 | 18.2% | 99 | -12.4% | 87 | 66 | 96.0% |
| Lakeview | $381,000 | 2.4% | 819 | -4.7% | 737 | -14.8% | 848 | 55 | 98.3% |
| Lakeview / Wrigleyville | $381,500 | 2.5% | 822 | -4.6% | 737 | -14.9% | 850 | 55 | 98.3% |
| Lincoln Park | $471,250 | 0.3% | 334 | 10.2% | 337 | -9.7% | 414 | 52 | 98.1% |
| Lincoln Square | $320,500 | -16.8% | 116 | 6.4% | 144 | 9.9% | 147 | 68 | 97.9% |
| Logan Square | $341,000 | 0.3% | 225 | -9.3% | 202 | 0.0% | 259 | 44 | 100.0% |
| McKinley Park | $242,500 | 33.2% | 16 | -36.0% | 35 | -2.8% | 31 | 87 | 97.6% |
| Montclare | $194,500 | -3.5% | 27 | -30.8% | 42 | -34.4% | 38 | 77 | 96.5% |
| Mount Greenwood | $219,900 | 10.4% | 77 | 37.5% | 89 | 45.9% | 97 | 60 | 97.0% |
| Naperville | $381,713 | 12.3% | 510 | 72.9% | 1,299 | -9.0% | 367 | 70 | 97.3% |
| Near North Side | $415,000 | 1.5% | 950 | 0.4% | 1,124 | -14.4% | 1,192 | 59 | 98.4% |
| North Center | $475,000 | -7.0% | 95 | -24.6% | 116 | -29.7% | 110 | 53 | 97.4% |
| Oakland | $264,000 | -5.4% | 17 | -45.2% | 22 | -26.7% | 18 | 83 | 99.1% |
| Old Town | $394,250 | 2.0% | 112 | -6.7% | 93 | -33.6% | 137 | 49 | 98.6% |
| Portage Park | $255,000 | -1.5% | 175 | 4.8% | 205 | -18.6% | 228 | 56 | 98.9% |
| Pullman | $45,250 | 36.1% | 12 | -25.0% | 23 | -28.1% | 16 | 144 | 100.4% |
| Ravenswood | $366,000 | 7.2% | 145 | 15.1% | 146 | -3.3% | 172 | 50 | 98.7% |
| River North | $425,000 | 4.2% | 327 | 8.3% | 297 | -14.7% | 355 | 50 | 99.8% |
| Rogers Park | $177,000 | -1.5% | 165 | 7.1% | 241 | -0.8% | 229 | 71 | 97.6% |
| Roscoe Village | $453,250 | -10.7% | 136 | 7.9% | 144 | -4.0% | 130 | 51 | 99.0% |
| Sauganash | $401,000 | 2.2% | 54 | 22.7% | 68 | -12.8% | 84 | 62 | 97.2% |
| South Lawndale / Little Village | $70,000 | -19.5% | 13 | -62.9% | 50 | -36.7% | 18 | 78 | 105.1% |
| South Loop | $354,750 | 4.3% | 402 | -1.5% | 378 | -15.4% | 498 | 56 | 100.3% |
| South Shore | $62,000 | 69.9% | 73 | -21.5% | 146 | -20.2% | 114 | 99 | 98.6% |
| Streeterville | $402,000 | -12.6% | 237 | -3.3% | 379 | -6.7% | 335 | 75 | 97.0% |
| The Loop | $388,500 | 9.4% | 240 | 5.7% | 360 | 14.3% | 480 | 58 | 98.9% |
| Tri-taylor | $175,000 | -19.4% | 19 | -13.6% | 20 | -37.5% | 27 | 60 | 97.6% |
| Ukrainian Village | $431,500 | -10.5% | 55 | 7.8% | 34 | -22.7% | 54 | 48 | 99.1% |
| Uptown | $265,000 | 3.9% | 314 | 19.4% | 275 | -23.2% | 365 | 51 | 97.6% |
| Washington Park | $65,000 | 57.8% | 8 | -73.3% | 26 | -18.8% | 17 | 102 | 107.6% |
| West Loop | $390,000 | -2.1% | 329 | 0.3% | 194 | -7.6% | 368 | 40 | 100.6% |
| West Town | $433,750 | 1.9% | 616 | -10.2% | 504 | -6.0% | 708 | 44 | 99.5% |
| Wicker Park | $445,000 | -9.2% | 102 | -30.6% | 118 | 4.4% | 148 | 41 | 99.4% |
| Chicago, IL | $285,000 | 3.6% | 3,831 | -6.2% | 12,037 | -12.3% | 4,012 | 55 | 98.6% |
NOTE: Not all neighborhoods are listed, but totals for Chicago encompass the entire city. Data is based on listing information and might not reflect all real estate activity in the market. Neighborhood-specific data is measured over a three-month span that ended June 30. Inventory measures listings active as of June 30.
For more information, contact Redfin journalist services:
Phone: 206-588-6863
Email: press@redfin.com
See Redfin’s data center to find out what’s happening in other cities.
To be added to Redfin’s press release distribution list, subscribe here.


