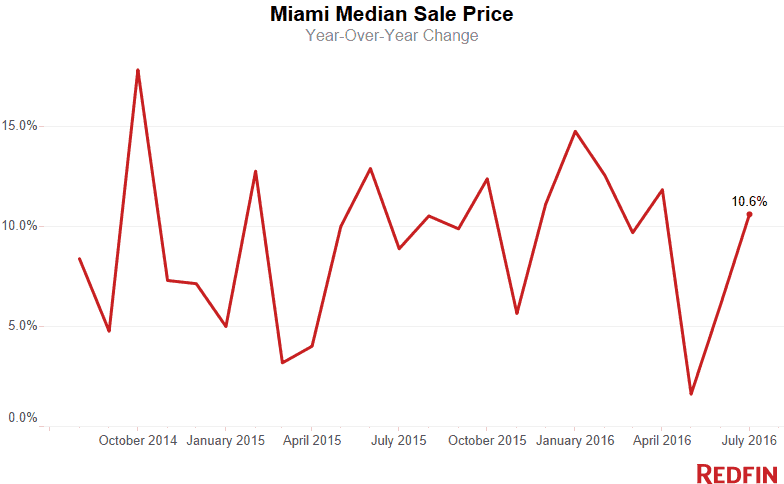
Miami home prices jumped 10.6 percent in July from a year ago to a median sale price of $271,000. Prices have not shown year-over-year declines since July 2011.
High home prices seem to have discouraged buyers, as Miami home sales plummeted 25.3 percent in July, continuing an eight-month trend of year-over-year declines. July’s sales drop was the largest since at least February 2010, when Redfin began tracking the numbers.
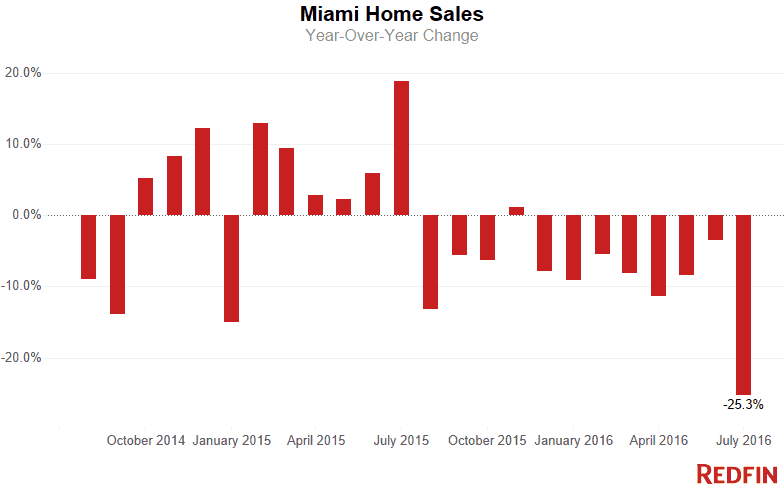
Miami sales are on a downward spiral, and even though the calendar makes July sales look particularly low, it doesn’t negate the consistent slowdown we’ve seen in the Miami market over the past two years.
Also contributing to the sales decline was that homebuyers had fewer homes to choose from. New listings dropped 11.3 percent year over year, and overall inventory dropped 1.5 percent. The typical home spent 53 days on the market, which is nine days less than this time last year.
Condos
In the condo market, home sales fell even further, declining 31.3 percent year over year. The median sale price for Miami condos was $195,000, up 21.5 percent from last year.
“It may look surprising that prices have risen so much given that sales also declined dramatically, but much of the available condo inventory is priced in the $300,000 range and higher, which drives up the overall median price,” said Aaron Drucker, a Redfin real estate agent in Miami.
The condo market continues to be oversaturated with more listed properties than there are willing buyers; there is currently a 10.1-month supply of condos for sale, which is greater than the six months that signals a balanced market between buyers and sellers.
The number of new condos hitting the market dropped by 5.2 percent in July, but the overall supply ticked up 7.5 percent as more condos sat on the market without selling. A typical condo spent 79 days on the market before selling, the same as last year.
Single-Family Homes
The softening condo market is beginning to transfer to the single-family home market in Miami, as well. The median single-family home sale price was $315,000 in July, up 12.5 percent from last year, but sales dropped 20.2 percent.
Redfin agents note that even in historically affordable neighborhoods, some buyers are getting priced out of single-family residences, leading to a decline in home sales. In Hialeah, for example, prices for all home types rose 28.8 percent to a median $201,000, and sales dropped 24.2 percent as fewer buyers adjusted to the steep price hikes.
“We’ve seen five years of nearly consistent price growth in the single-family home market here in Miami, and it’s getting to a point where we will need to reach an equilibrium,” said Drucker. “The lower sales volume is a healthy sign for the real estate market long term; if sales continue to fall, prices will begin to stabilize.”
The number of new single-family homes hitting the market fell by 15.1 percent in July, the largest drop we have seen in years. That contributed to a drop of 9.2 percent in the total number of single-family homes for sale, but with only 3.7 months of supply, it’s still a seller’s market.
Neighborhood Trends
Pinecrest fetched some of the highest prices with a median sale price of $1,021,000, an 8.6 percent year-over-year increase. Little Havana had a much lower median sale price of $131,000, up 2.3 percent year over year.
Palmetto Bay had a 19.4 percent increase in home sales, and on the low end, Kendall saw a 43.4 percent drop.
See our city page for the most up-to-date data on Miami home prices.
Here’s what’s happening in your neighborhood:
| Place | Median Sale Price | Year-Over-Year | Homes Sold | Year-Over-Year | Inventory | Year-Over-Year | New Listings | Median Days on Market | Avg Sale-to-List |
|---|---|---|---|---|---|---|---|---|---|
| Andover | $216,000 | 20.0% | 5 | 66.7% | NA | NA | 3 | 12 | 94.7% |
| Aventura | $300,000 | -1.6% | 292 | -20.4% | 1,306 | 17.3% | 668 | 123 | 93.5% |
| Bal Harbour | $1,850,000 | 173.1% | 8 | -42.9% | 183 | 39.7% | 20 | 129 | 90.4% |
| Bay Harbor Islands | $331,000 | -4.1% | 14 | 27.3% | 150 | 37.6% | 25 | 176 | 95.1% |
| Bay Point | $1,900,000 | -58.1% | 1 | -50.0% | 16 | 33.3% | 7 | 649 | 87.4% |
| Bayshore | $1,150,000 | 20.4% | 25 | -34.2% | 122 | 24.5% | 49 | 109 | 92.6% |
| Beach Plaza | $107,800 | NA | 1 | NA | NA | NA | NA | 16 | 138.2% |
| Biscayne Park | $350,000 | -6.7% | 9 | 0.0% | 29 | 52.6% | 8 | 69 | 95.4% |
| Biscayne Point | $781,000 | 168.2% | 27 | -20.6% | 65 | 0.0% | 30 | 91 | 93.9% |
| Brentwood | $192,500 | 16.7% | 6 | -14.3% | 3 | -25.0% | 9 | 65 | 101.3% |
| Brickell | $375,000 | -9.1% | 233 | -20.2% | 1,417 | 8.3% | 627 | 125 | 94.0% |
| Coral Gables | $640,000 | 27.4% | 108 | -15.6% | 667 | 9.5% | 123 | 64 | 95.2% |
| Coral Way | $400,000 | 18.6% | 191 | -18.4% | 423 | -0.5% | 295 | 63 | 95.6% |
| Cutler Bay | $249,000 | 12.7% | 79 | -18.6% | 238 | -25.6% | 111 | 34 | 96.7% |
| Doral | $320,000 | 12.3% | 83 | -24.6% | 830 | 22.8% | 147 | 104 | 95.5% |
| Downtown | $395,000 | 1.9% | 128 | -21.0% | 795 | 13.2% | 314 | 148 | 94.1% |
| Eastern Shores | $176,000 | 5.4% | 36 | -14.3% | 111 | 44.2% | 59 | 117 | 94.8% |
| El Portal | $484,500 | 31.9% | 4 | -55.6% | 26 | 188.9% | 9 | 39 | 97.4% |
| Fisher Island | $6,820,000 | 241.0% | 2 | 100.0% | 62 | 44.2% | 7 | 288 | 83.9% |
| Flamingo-Lummus | $243,500 | 16.0% | 100 | -21.9% | 455 | 4.1% | 219 | 119 | 94.7% |
| Hialeah | $201,000 | 28.8% | 304 | -24.2% | 257 | -27.2% | 350 | 32 | 97.9% |
| Highland Village | $74,000 | 27.6% | 3 | 50.0% | NA | NA | 1 | 42 | 94.3% |
| Homestead | $192,000 | 20.0% | 254 | -9.9% | 625 | -22.4% | 278 | 42 | 97.7% |
| Kendall | $280,000 | 26.7% | 90 | -43.4% | 346 | -12.8% | 125 | 43 | 96.1% |
| Key Biscayne | $830,000 | -33.1% | 20 | -39.4% | 296 | 42.3% | 33 | 109 | 94.6% |
| Keystone Point | $790,000 | -29.0% | 10 | -44.4% | 52 | 33.3% | 19 | 77 | 92.6% |
| La Gorce | $1,942,500 | 36.8% | 10 | -44.4% | 84 | 75.0% | 27 | 183 | 89.4% |
| Lakewood Estates | $210,000 | 39.5% | 1 | -50.0% | NA | NA | 1 | 7 | 105.1% |
| Little Haiti | $240,650 | 37.5% | 52 | -8.8% | 111 | 24.7% | 89 | 66 | 92.8% |
| Little Havana | $131,000 | 2.3% | 44 | -8.3% | 87 | -15.5% | 52 | 73 | 95.8% |
| Miami Lakes | $340,000 | 13.3% | 85 | -26.1% | 108 | -15.6% | 121 | 46 | 97.2% |
| Miami Shores | $410,000 | 13.9% | 95 | -24.6% | 149 | 9.6% | 117 | 80 | 95.7% |
| Miami Springs | $419,500 | 23.8% | 6 | -57.1% | 53 | 26.2% | 16 | 50 | 95.5% |
| New Belle Meade | $585,000 | -7.9% | 1 | 0.0% | 2 | -33.3% | 3 | 129 | 97.7% |
| Normandy Isle | $190,000 | -32.4% | 29 | -19.4% | 80 | 27.0% | 37 | 98 | 94.9% |
| North Bay Village | $280,000 | 25.8% | 22 | 0.0% | 238 | 38.4% | 36 | 206 | 94.5% |
| North Shore | $242,500 | -11.8% | 74 | -32.1% | 294 | 13.1% | 125 | 152 | 94.2% |
| Northeast Coconut Grove | $654,750 | -3.0% | 148 | -7.5% | 374 | 35.0% | 243 | 74 | 94.5% |
| Overtown | $178,000 | 42.4% | 9 | -30.8% | 17 | -15.0% | 12 | 48 | 99.3% |
| Palm Island | $5,200,000 | -17.2% | 4 | 100.0% | 20 | 42.9% | 4 | 480 | 88.6% |
| Palmetto Bay | $500,000 | 7.5% | 43 | 19.4% | 184 | 16.5% | 48 | 35 | 96.5% |
| Pinecrest | $1,021,000 | 8.6% | 32 | -15.8% | 214 | 35.4% | 36 | 84 | 94.5% |
| South Miami | $430,000 | -5.6% | 61 | 1.7% | 72 | -6.5% | 65 | 44 | 95.2% |
| South Point | $732,500 | -5.5% | 65 | 14.0% | 314 | 57.0% | 120 | 149 | 93.0% |
| Southwest Coconut Grove | $750,000 | 0.1% | 53 | -8.6% | 120 | 6.2% | 73 | 97 | 92.6% |
| Sunny Isles Beach | $467,500 | 28.1% | 54 | -33.3% | 1,185 | 44.5% | 134 | 155 | 91.7% |
| Sweetwater | $169,500 | -0.3% | 10 | 100.0% | 12 | -58.6% | 6 | 69 | 95.4% |
| The Roads | $549,000 | 46.5% | 25 | -10.7% | 47 | -17.5% | 30 | 49 | 94.2% |
| Upper Eastside | $404,000 | 19.5% | 66 | -25.8% | 211 | 58.7% | 118 | 88 | 95.0% |
| Venetian Islands | $825,000 | -13.6% | 27 | 35.0% | 86 | 30.3% | 38 | 161 | 90.2% |
| West Avenue | $266,500 | -23.8% | 64 | -36.0% | 300 | 27.7% | 130 | 120 | 94.3% |
| West Flagler | $270,000 | 20.5% | 81 | -3.6% | 88 | -21.4% | 75 | 42 | 95.4% |
| West Miami | $352,500 | 18.1% | 4 | -33.3% | 16 | 0.0% | 4 | 30 | 108.8% |
| Wynwood-Edgewater | $370,000 | 1.4% | 100 | -20.6% | 601 | 27.9% | 265 | 136 | 95.3% |
| Miami, FL | $271,000 | 10.6% | 1,388 | -25.3% | 7,977 | -1.5% | 1,923 | 53 | 96.6% |
For more information, contact Redfin journalist services
Phone: 206-588-6863
Email: press@redfin.com
See Redfin’s data center to find out what’s happening in other cities.
To be added to Redfin’s press release distribution list, subscribe here.
 United States
 Canada