
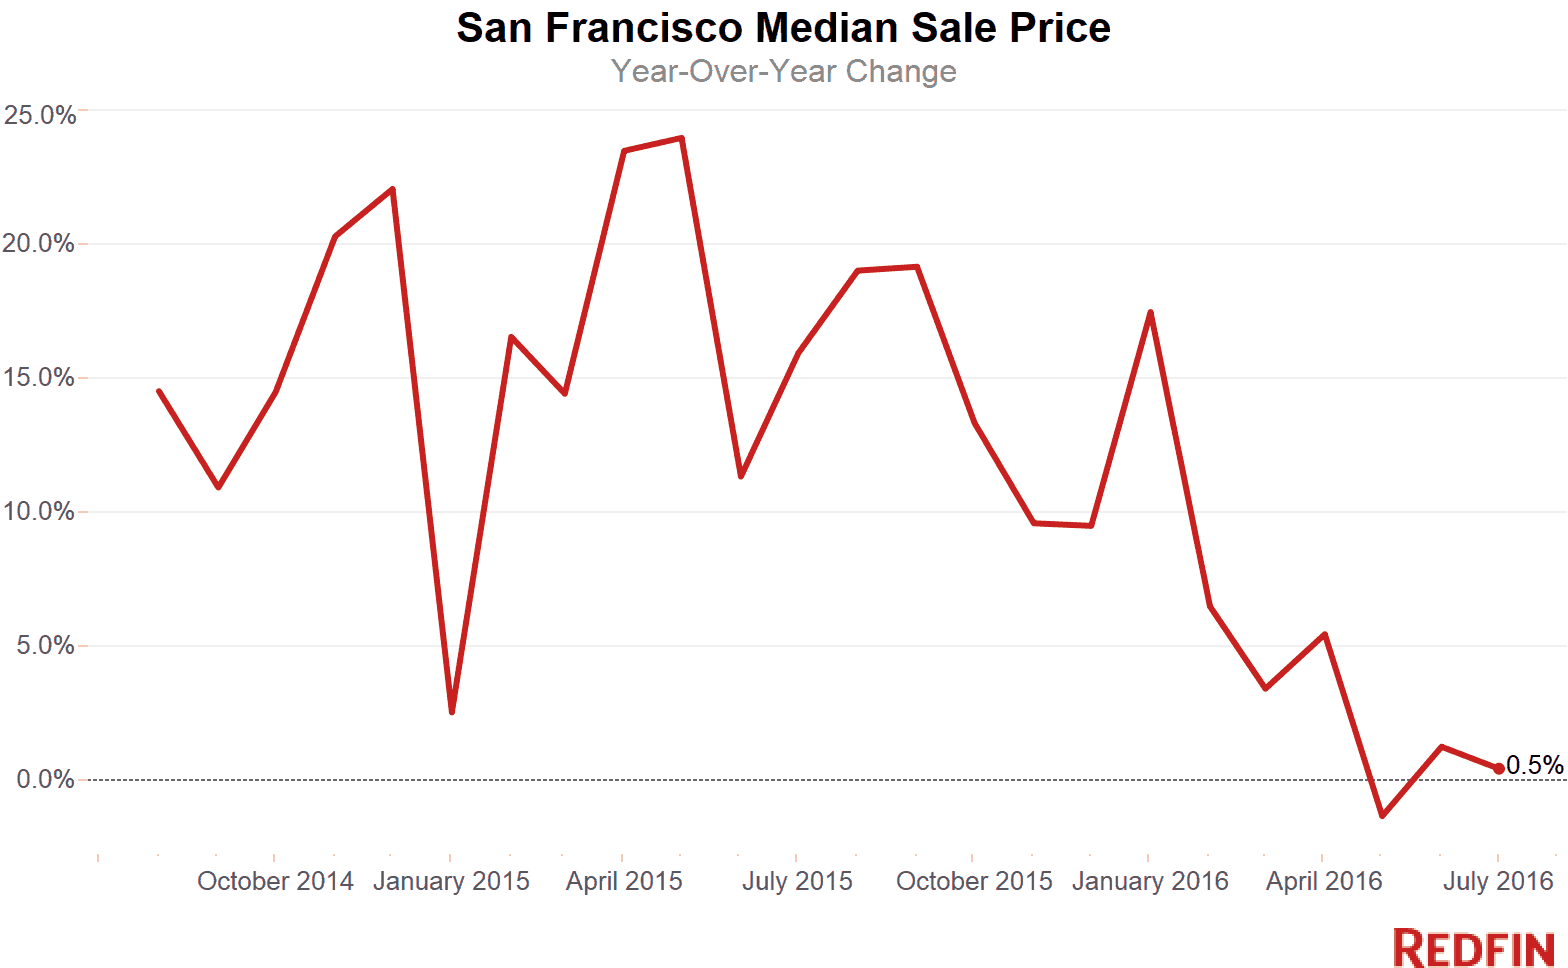
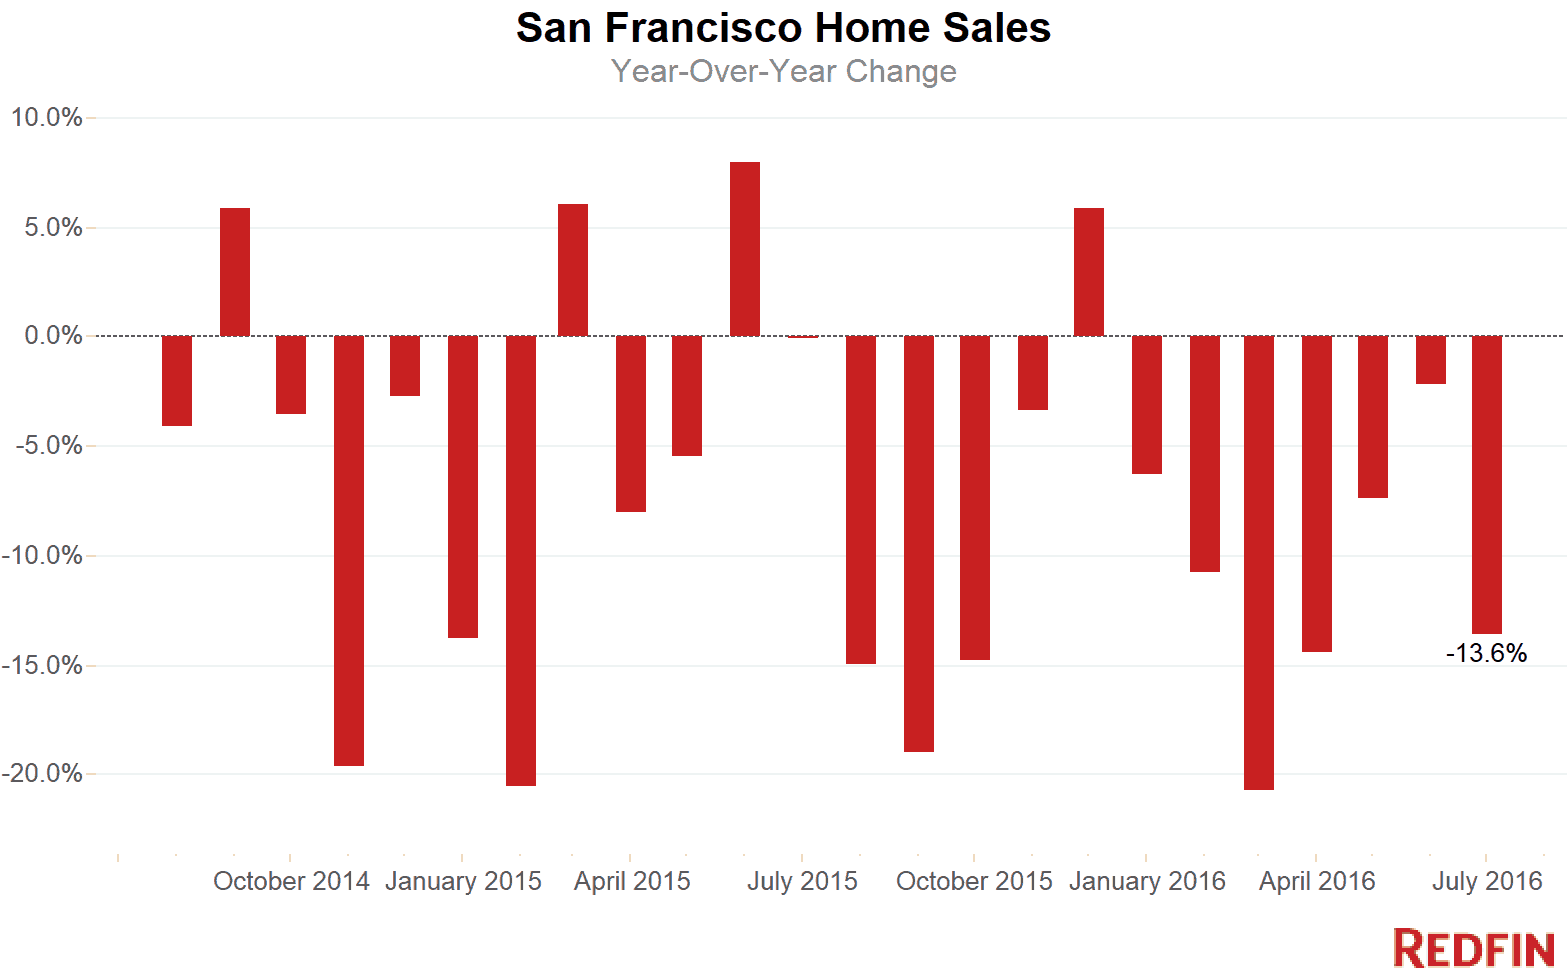
San Francisco home sales slowed for the seventh month, falling nearly 13.6 percent in July from a year earlier. Sale prices were steady, inching up less than half a percent to a median $1.2 million.
The city’s price growth has slowed rapidly after four years of double-digit inflation as buyers shy away from record price tags and bidding wars, especially for condos. Supply is inching up, too, as more sellers put homes on the market.
In July, there was more than a two-month supply of homes for sale, a rarity in a city known for its tight housing inventory. Still, the supply of houses on the market remains extraordinarily low. Economists consider a market balanced between buyers and sellers when there’s a six-month supply of houses for sale.
Condo inventory almost doubled and single-family inventory was up 39 percent. Overall, the number of properties for sale has risen every month since December.
Although inventory has improved, it hasn’t caught up with demand, which is one reason sales have been slower this year than last. The dramatic year-over-year drop in sales last month was partly caused by the city’s hot market last summer. Prices were up nearly 16 percent year over year in July 2015 as bidding wars engulfed the city. But there’s little doubt last month brought a slowdown. For the first time this year, month-over-month sales volume fell.
That might bring relief to buyers, especially those shopping for condos, which have been taking longer to sell. The typical condo was on the market 24 days in July, up from 18 in June. For condos, July was the slowest market since January 2013.
“Last year in July condos were flying off the shelf. Now they’re not,” Redfin agent Mark Colwell said. “People aren’t so much scared that the market has peaked, they’re scared the condo market has peaked.”
Single-family properties are still in demand and the slowdown in price growth ultimately is healthy, Colwell said.
“I just bought recently. I firmly believe we’re just returning to an age of normalcy, which is a good thing,” he said.
Bay Area
Across the greater Bay Area, the median sale price rose 4.8 percent in July to $1.15 million. Sales slowed by a dramatic 14.5 percent year over year. Compared to the first seven months of 2015, sales in the region are down 8.8 percent.
Hot Neighborhoods
Prices in Nob Hill jumped 74 percent from a year ago to a median $2.24 million, with 19 sales last month. The gain was led by the sale of a three-bedroom, two-level condominium that went for nearly $4.8 million, or $1,683 a square foot.
Compared to a year ago, sellers had less pricing power in all but one of the city’s costliest communities as fewer properties fetched above asking price. The exception was Inner Richmond, where the typical home sold for $1.193 million and more sellers got above what they were asking compared to July 2015.
The Tenderloin continued its streak as the city’s least-expensive community, with a median sale price of $594,000 based on eight sales. It was the only neighborhood where a typical home could be had for less than $600,000.
See our city page for the most up-to-date data on San Francisco home prices.
Here’s what’s happening in your neighborhood:
| Place | Median Sale Price | Year-Over-Year | Homes Sold | Year-Over-Year | Inventory | Year-Over-Year | New Listings | Median Days on Market | Avg Sale-to-List |
|---|---|---|---|---|---|---|---|---|---|
| Ashbury Heights | $1,630,000 | 30.4% | 15 | -28.6% | 5 | 25.0% | 11 | 14 | 107.6% |
| Bernal Heights | $1,270,000 | 3.9% | 72 | 30.9% | 38 | 58.3% | 78 | 14 | 117.3% |
| Civic Center / Van Ness | $750,000 | -9.6% | 21 | -30.0% | 29 | 93.3% | 51 | 18 | 107.8% |
| Crocker Amazon | $925,000 | 7.9% | 10 | -16.7% | 11 | -21.4% | 20 | 16 | 108.7% |
| Daly City | $807,000 | 9.9% | 52 | 0.0% | 101 | 21.7% | 69 | 19 | 107.8% |
| Excelsior | $877,500 | 6.4% | 24 | 4.3% | 13 | -23.5% | 28 | 14 | 110.5% |
| Financial District | $1,625,000 | 1.6% | 5 | -28.6% | 7 | 40.0% | 10 | 26 | 98.6% |
| Forest Hill | $2,192,500 | -12.7% | 6 | -33.3% | 2 | 0.0% | 7 | 18 | 106.9% |
| Haight Ashbury | $1,300,000 | -11.9% | 9 | 0.0% | 4 | NA | 10 | 15 | 109.4% |
| Hayes Valley | $1,760,000 | 21.8% | 15 | 114.3% | 11 | 10.0% | 19 | 18 | 106.1% |
| Ingleside | $889,000 | 4.0% | 15 | 15.4% | 6 | 100.0% | 18 | 15 | 113.7% |
| Inner Richmond | $1,930,000 | 21.6% | 21 | -50.0% | 11 | -26.7% | 26 | 13 | 110.4% |
| Inner Sunset | $1,410,000 | 0.7% | 29 | 11.5% | 11 | -15.4% | 21 | 18 | 111.8% |
| Lower Haight | $1,433,000 | 12.4% | 15 | 7.1% | 4 | 0.0% | 15 | 13 | 115.4% |
| Merced Heights | $719,000 | 16.0% | 16 | 100.0% | 3 | -76.9% | 14 | 21 | 106.9% |
| Miraloma Park | $1,225,000 | -12.8% | 38 | -17.4% | 25 | 108.3% | 39 | 18 | 107.0% |
| Mission | $1,230,000 | 7.0% | 38 | -28.3% | 23 | 9.5% | 46 | 17 | 108.5% |
| Mission Bay | $1,180,000 | -9.8% | 35 | 9.4% | 20 | 100.0% | 39 | 36 | 100.0% |
| Nob Hill | $2,245,000 | 74.4% | 19 | -20.8% | 21 | 162.5% | 31 | 32 | 99.9% |
| Noe Valley | $1,650,000 | -13.8% | 68 | -1.4% | 28 | 86.7% | 65 | 16 | 107.6% |
| Outer Mission | $625,000 | -32.0% | 12 | 50.0% | 5 | -28.6% | 15 | 25 | 102.2% |
| Outer Sunset | $1,090,000 | 8.5% | 42 | -12.5% | 13 | 0.0% | 34 | 15 | 116.4% |
| Pacific Heights | $1,850,000 | 24.2% | 59 | 7.3% | 36 | 100.0% | 72 | 19 | 104.0% |
| Parkside | $1,292,500 | 9.5% | 22 | -29.0% | 11 | -8.3% | 25 | 15 | 119.0% |
| Portola | $950,000 | 18.8% | 7 | -66.7% | 7 | -30.0% | 16 | 26 | 106.5% |
| Potrero Hill | $1,100,000 | -12.7% | 41 | 0.0% | 24 | 118.2% | 43 | 15 | 107.9% |
| Rincon Hill | $1,135,000 | 1.3% | 33 | -13.2% | 52 | 188.9% | 65 | 29 | 99.5% |
| Russian Hill | $1,350,000 | -28.9% | 31 | 10.7% | 18 | 80.0% | 35 | 15 | 104.2% |
| South of Market | $912,500 | -6.0% | 66 | -32.6% | 94 | 147.4% | 130 | 27 | 103.3% |
| South San Francisco | $820,000 | 5.1% | 38 | -13.6% | 82 | 67.3% | 51 | 21 | 107.7% |
| Sunnyside | $1,050,000 | -10.6% | 15 | -34.8% | 9 | 200.0% | 16 | 18 | 112.9% |
| Sunset District | $1,275,000 | 2.0% | 159 | -4.8% | 60 | 25.0% | 148 | 14 | 117.0% |
| Telegraph Hill | $1,495,000 | 30.0% | 14 | 7.7% | 5 | 25.0% | 13 | 19 | 103.2% |
| Tenderloin | $594,000 | -41.2% | 8 | 60.0% | 7 | 133.3% | 5 | 13 | 106.6% |
| Twin Peaks | $1,492,000 | 54.2% | 3 | -75.0% | 6 | 50.0% | 6 | 14 | 103.2% |
| Visitacion Valley | $730,000 | -2.7% | 9 | -18.2% | 5 | -16.7% | 15 | 14 | 108.6% |
| Western Addition | $823,750 | -25.6% | 14 | -41.7% | 6 | -14.3% | 17 | 18 | 106.1% |
| San Francisco, CA | $1,200,000 | 0.5% | 458 | -13.6% | 948 | 65.2% | 519 | 20 | 108.1% |
NOTE: Not all neighborhoods are listed, but totals for San Francisco encompass the entire city. Data is based on listing information and might not reflect all real estate activity in the market. Neighborhood-specific data is measured over a three-month span that ended July 31. Inventory measures listings active as of July 31.
For more information, contact Redfin journalist services
Phone: 206-588-6863
Email: press@redfin.com
See Redfin’s data center to find out what’s happening in other cities.
To be added to Redfin’s press release distribution list, subscribe here.


