
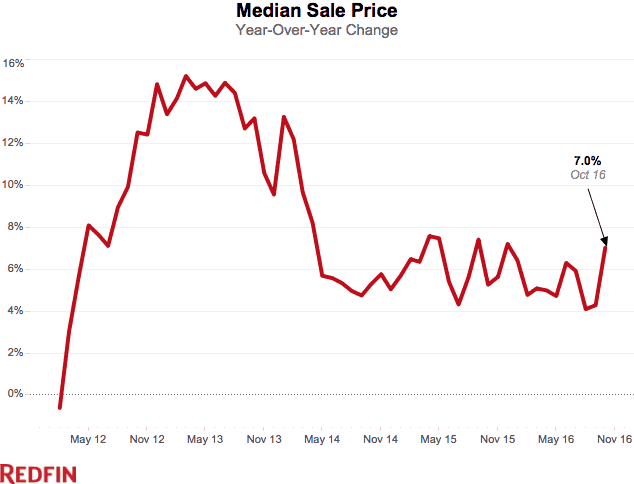
The median home sale price increased 7 percent in October, the strongest year-over-year growth Redfin has seen in 10 months. Overall home inventory declined for the 13th month with an 8.6 percent year-over-year drop, the biggest decline since May 2013. New listings dropped 6.9 percent, the largest year-over-year decline since December 2012.
Although the substantial increase in home prices and other speed and competition metrics reflect a very active housing market last month, the number of homes sold declined 3.2 percent year over year following two months of double-digit surges in metros tracked by Redfin.
Last month, homes spent a median 49 days on the market, five fewer than a year earlier. More than one in five (21.3%) homes went under contract within two weeks in October, up from 19 percent a year earlier. Another one in five (20.1%) homes sold for more than their asking price, up from 18.9 percent a year earlier.
Seven Florida metros led the nation in home price growth–including Deltona (up 18.4 percent), West Palm Beach (14.8 percent), Fort Lauderdale (14.2 percent), Fort Myers (14.1 percent) and Lakeland (13.6 percent).
“Florida’s growing economy and relatively affordable prices have brought more transplants here this past year,” said Delray Valle, Redfin real estate agent in West Palm Beach. “Local sellers see that they can price high and make a decent profit on the newcomers. Even homeowners who bought at the top of the market just before the recession can now easily fetch double what they paid for at the time, as long as they are patient enough to find the right buyer.”
| Market Summary | October 2016 | Month-Over-Month | Year-Over-Year |
|---|---|---|---|
| Median sale price | $269,200 | 0.7% | 7.0% |
| Homes sold | 222,700 | -13.1% | -3.2% |
| New listings | 247,100 | -12.7% | -6.9% |
| All Homes for sale | 797,900 | -5.4% | -8.6% |
| Median days on market | 49 | 3 | -5 |
| Months of supply | 3.6 | 0.3 | -0.2 |
| Sold above list | 20.1% | -1.0% | 1.3% |
| Average Sale-to-list | 93.5% | 0.0% | -0.9% |
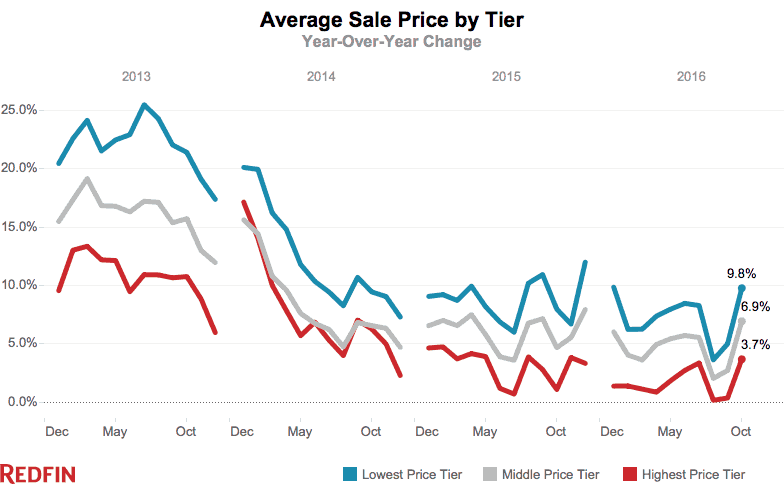
While the October market rewarded sellers, it hit buyers at the low end of the market the hardest. The lack of affordable new construction, high investor demand for rental units and a slowdown in new listings sent prices for starter homes up faster than they have grown all year. With no new supply surge on the horizon, finding an affordable home will continue to be an unrelenting challenge for first-time buyers for the remainder of the year and into 2017. The good news is that mortgage rates continue to provide an affordability cushion, giving buyers a bit of wiggle room against budget constraints.
Other October Highlights
Prices
- Deltona, FL had the nation’s highest price growth, rising 18.4% since last year to $167,000.
- Two metros saw price declines of more than 1% in October: Camden, NJ (-6.7%) and Washington, DC (-2.7%).
Sales
- 14.3% of metros saw sales surge by double digits from last year. St. Louis, MO led the nation in year-over-year sales growth, up 32.8%, followed by Memphis, TN, up 29.1%. Baton Rouge, LA rounded out the top three with sales up 23.7% from a year ago.
- Columbia, SC saw the largest decline in sales since last year, falling 56.9%. Home sales in Miami, FL and Fort Lauderdale, FL declined by 32.8% and 26.4%, respectively.
Competition
- Seattle, WA was the fastest market, with half of all homes pending sale in just 13 days, down from 15 days from a year earlier. Denver, CO and Oakland, CA were the next fastest market with 15 and 17 median days on market.
- Competitive buyers were in San Francisco, CA where 59.8% of homes sold above list price, followed by 56.6% in San Jose, CA and 54.1% in Oakland, CA. In sharp contrast, no homes sold above list price in Pittsburgh, PA, Hudson Valley, NY, Kansas City, MO, and Fort Myers, FL.
Inventory
- Buffalo, NY had the largest decrease in overall inventory, falling 32.4% since last October. Fresno, CA (-30.2%), Portsmouth, NH (-29.2%), and Rochester, NH (-28.0%) also continued seeing far fewer homes available on the market than a year ago.
- St. Louis, MO had the highest increase in the number of homes for sale, up 24.6% year over year, followed by San Francisco, CA (20.1%) and San Jose, CA (15.8%).
Below are market-by-market breakdowns for prices, inventory, new listings and sales for markets with populations of 2 million or more. For downloadable data on all of the markets Redfin tracks, visit the Redfin Data Center.
Median Sale Price
| Redfin Metro | Median Sale Price | Month-Over-Month | Year-Over-Year |
|---|---|---|---|
| Atlanta, GA | $199,000 | -0.5% | 7.6% |
| Baltimore, MD | $252,700 | -0.9% | 7.6% |
| Boston, MA | $360,000 | -2.4% | 4.6% |
| Chicago, IL | $215,000 | -2.3% | 4.9% |
| Cleveland, OH | $130,000 | -3.3% | 7.4% |
| Dallas-Fort Worth, TX | $234,900 | 1.7% | 11.9% |
| Denver, CO | $345,900 | 0.3% | 12.2% |
| Detroit, MI | $157,500 | 0.0% | 4.3% |
| Edison, NJ | $283,000 | -0.4% | -0.7% |
| Houston, TX | $216,000 | -0.2% | 6.9% |
| Kansas City, MO | $180,000 | -2.7% | 2.9% |
| Las Vegas, NV | $215,000 | 0.0% | 8.6% |
| Long Island, NY | $400,000 | -0.7% | 6.7% |
| Los Angeles, CA | $538,000 | 0.6% | 8.7% |
| Miami, FL | $256,000 | -3.4% | 10.3% |
| Minneapolis-St. Paul, MN | $233,400 | -0.3% | 8.2% |
| Oakland, CA | $620,000 | 2.1% | 9.7% |
| Orange County, CA | $639,000 | 2.4% | 9.2% |
| Orlando, FL | $202,000 | -1.4% | 12.2% |
| Philadelphia, PA | $230,000 | -0.4% | 2.2% |
| Phoenix, AZ | $230,000 | -1.3% | 7.0% |
| Pittsburgh, PA | $148,000 | -1.3% | 5.3% |
| Portland, OR | $340,000 | 0.0% | 13.3% |
| Riverside-San Bernardino, CA | $317,000 | -0.9% | 7.5% |
| Sacramento, CA | $344,000 | -0.3% | 9.2% |
| San Antonio, TX | $196,000 | -0.8% | 7.1% |
| San Diego, CA | $520,000 | 4.0% | 12.9% |
| Seattle, WA | $440,000 | -2.2% | 8.6% |
| St. Louis, MO | $163,400 | -0.9% | 0.3% |
| Tampa, FL | $187,200 | -1.4% | 14.2% |
| Washington, DC | $355,000 | -1.4% | -2.7% |
| National | $269,200 | 0.7% | 7.0% |
All Homes for Sale
| Redfin Metro | All Homes for Sale | Month-Over-Month | Year-Over-Year |
|---|---|---|---|
| Atlanta, GA | 34,524 | 3.0% | 0.8% |
| Baltimore, MD | 11,720 | -7.0% | -18.2% |
| Boston, MA | 13,043 | -9.6% | -25.0% |
| Chicago, IL | 43,951 | -7.0% | -10.8% |
| Cleveland, OH | 9,530 | -4.9% | -19.5% |
| Dallas-Fort Worth, TX | 16,005 | -11.1% | -15.3% |
| Denver, CO | 7,056 | -13.1% | -22.3% |
| Detroit, MI | 14,150 | -8.3% | -25.5% |
| Edison, NJ | 14,062 | -10.5% | -11.1% |
| Houston, TX | 23,712 | -5.7% | 2.1% |
| Las Vegas, NV | 12,559 | -4.3% | -12.5% |
| Long Island, NY | 11,534 | -6.2% | -20.7% |
| Los Angeles, CA | 17,689 | -7.8% | 9.3% |
| Miami, FL | 18,105 | -0.3% | 5.7% |
| Minneapolis-St. Paul, MN | 12,366 | -10.1% | -15.5% |
| Oakland, CA | 3,325 | -14.5% | -5.1% |
| Orange County, CA | 7,659 | -13.1% | 5.9% |
| Orlando, FL | 10,445 | -7.7% | -18.9% |
| Philadelphia, PA | 16,279 | -2.5% | -17.4% |
| Phoenix, AZ | 22,206 | 0.7% | -3.0% |
| Portland, OR | 6,528 | -12.8% | -3.9% |
| Riverside-San Bernardino, CA | 16,761 | -5.0% | 3.3% |
| Sacramento, CA | 5,500 | -13.1% | -14.7% |
| San Antonio, TX | 6,830 | -9.5% | -11.4% |
| San Diego, CA | 6,165 | -9.8% | -16.8% |
| Seattle, WA | 5,477 | -20.0% | -14.1% |
| St. Louis, MO | 14,564 | 2.6% | 24.6% |
| Tampa, FL | 14,273 | -7.5% | -12.4% |
| Washington, DC | 17,871 | -9.2% | -23.1% |
| National | 797,900 | -5.4% | -8.6% |
New Listings
| Redfin Metro | New Listings | Month-Over-Month | Year-Over-Year |
|---|---|---|---|
| Atlanta, GA | 8,727 | -9.8% | -2.7% |
| Baltimore, MD | 3,726 | -10.1% | -9.4% |
| Boston, MA | 5,982 | -23.9% | -11.4% |
| Chicago, IL | 9,703 | -18.2% | -14.5% |
| Cleveland, OH | 2,478 | -6.1% | -10.1% |
| Dallas-Fort Worth, TX | 7,838 | -8.0% | -4.0% |
| Denver, CO | 4,470 | -19.4% | -11.3% |
| Detroit, MI | 5,568 | -9.2% | -9.3% |
| Edison, NJ | 3,033 | -11.1% | -7.2% |
| Houston, TX | 7,538 | -6.3% | -5.0% |
| Kansas City, MO | 2,866 | -13.1% | 11.0% |
| Las Vegas, NV | 3,570 | -6.5% | -7.5% |
| Long Island, NY | 2,590 | -8.5% | -4.0% |
| Los Angeles, CA | 7,136 | -21.0% | -6.1% |
| Miami, FL | 3,952 | -7.2% | -12.7% |
| Minneapolis-St. Paul, MN | 4,377 | -22.2% | -8.8% |
| Oakland, CA | 2,358 | -17.9% | -7.8% |
| Orange County, CA | 2,489 | -24.2% | -9.2% |
| Orlando, FL | 3,474 | -11.4% | -13.0% |
| Philadelphia, PA | 4,461 | -12.2% | -7.2% |
| Phoenix, AZ | 8,981 | 0.5% | -3.0% |
| Pittsburgh, PA | 1,940 | -5.9% | -0.2% |
| Portland, OR | 3,257 | -19.0% | -7.8% |
| Riverside-San Bernardino, CA | 5,677 | -16.7% | -9.8% |
| Sacramento, CA | 2,616 | -20.4% | -12.8% |
| San Antonio, TX | 2,271 | -7.2% | -7.1% |
| San Diego, CA | 3,044 | -10.1% | -8.8% |
| Seattle, WA | 3,517 | -31.8% | -9.7% |
| St. Louis, MO | 3,654 | -8.8% | 10.0% |
| Tampa, FL | 5,323 | -1.8% | -4.8% |
| Washington, DC | 7,000 | -18.9% | -13.8% |
| National | 247,100 | -12.7% | -6.9% |
Homes Sold
| Redfin Metro | Homes Sold | Month-Over-Month | Year-Over-Year |
|---|---|---|---|
| Atlanta, GA | 7,608 | -24.2% | -7.2% |
| Baltimore, MD | 3,158 | -6.7% | -2.7% |
| Boston, MA | 5,259 | -12.9% | -9.0% |
| Chicago, IL | 9,182 | -19.4% | -15.9% |
| Cleveland, OH | 2,211 | -9.0% | -5.0% |
| Dallas-Fort Worth, TX | 6,918 | -14.8% | -3.7% |
| Denver, CO | 4,608 | -22.0% | -10.6% |
| Detroit, MI | 5,710 | -16.1% | -0.8% |
| Edison, NJ | 2,437 | -11.2% | -10.4% |
| Houston, TX | 6,059 | -11.9% | -1.6% |
| Kansas City, MO | 2,753 | -13.0% | 8.6% |
| Las Vegas, NV | 3,100 | -9.1% | 3.9% |
| Long Island, NY | 2,407 | -2.7% | 2.8% |
| Los Angeles, CA | 6,255 | -6.9% | -4.5% |
| Miami, FL | 2,064 | -20.9% | -32.8% |
| Minneapolis-St. Paul, MN | 5,898 | -11.8% | 16.6% |
| Oakland, CA | 2,223 | -15.3% | -12.6% |
| Orange County, CA | 2,599 | -4.9% | 5.7% |
| Orlando, FL | 2,984 | -21.5% | -13.6% |
| Philadelphia, PA | 3,648 | -11.0% | -3.8% |
| Phoenix, AZ | 6,969 | -5.1% | 11.9% |
| Pittsburgh, PA | 1,796 | -10.5% | -7.0% |
| Portland, OR | 3,313 | -12.5% | -10.7% |
| Riverside-San Bernardino, CA | 4,531 | -9.5% | 0.7% |
| Sacramento, CA | 2,699 | -10.1% | -4.4% |
| San Antonio, TX | 2,066 | -13.1% | -1.9% |
| San Diego, CA | 2,968 | -10.5% | -1.1% |
| Seattle, WA | 4,380 | -8.3% | 6.6% |
| St. Louis, MO | 3,362 | -4.7% | 32.8% |
| Tampa, FL | 4,356 | -25.6% | -6.5% |
| Washington, DC | 6,223 | -12.7% | -0.3% |
| National | 222,700 | -13.1% | -3.2% |
Other popular posts:
1. Backyard Safety: Protect Your Kids from Poisonous Plants and Pesticides This Summer
2. Perfecting Your Dog’s Manners: Mastering Public Etiquette from Home
3. How to Plan a Home Memorial Service for Your Departed Loved One


