College football season is upon us; that means it’s time for fans to dust off their grills and coolers and slap on their favorite team’s car decal. Football Saturday and Sundays have become a social phenomenon and, as we covered the best NFL Stadiums to pregame last year, we’ve turned our attention to college football tailgating this year. After all, nothing beats an autumn Saturday hanging out with friends and family while enjoying some drinks, food and games in anticipation of kickoff.
So many schools take pride in having a unique gameday experience that’s full of fun and history, which makes it difficult to rank the very best. University of Mississippi has ‘The Grove,’ University of South Carolina has ‘The Cockaboose Railroad,’ University of Washington has ‘Husky Harbor’ and University of California at Berkeley has ‘Charter Hill,’ to name a few.
Since there’s copious amounts of fun to be had at pretty much every school, we decided to rank the factors that make a school’s tailgating experience more consistent year in and year out. For this ranking, we stuck to Power 5 conferences and weighed the following criteria that makes college football gameday better:
- Football program revenue – A great way to weigh fan support is to see how much money fans pour into their beloved team through ticket sales, merchandise and concessions. It’s also a good indicator of how much money schools can put back into their stadium and facilities to enhance gameday.
- Stadium capacity – The more the merrier; we don’t want to leave anybody out when celebrating our alma mater or favorite team!
- Team win percentage over the past seven years – Let’s face it, everybody loves a winner and it’s more fun to root for a team that consistently wins at home.
- Walk Score – Having bars, restaurants and other amenities near the stadium is a huge draw for those without a parking pass. It’s also a better gameday experience when fans don’t have to walk, Uber or Lyft or drive long distances to get to the stadium.
- Median Home Sale Price – It helps to live in a city that is more affordable, it also clears more financial room to help support the home team!
Redfin real estate agents played safety, weighing in on their local college’s tailgating experiences to ensure the list was accurate.
As far as the results, Big 10 and SEC schools dominated the list, taking nine of 10 spots with the only holdout being Oklahoma, which represents the Big 12. Traditional powerhouses Ohio State, Alabama, LSU, Oklahoma and Michigan filled out the top five, with huge stadiums and lots of athletic department revenue feeding their high ranks. Another differentiator is each school in the top 10 has a stadium located on campus. Here’s the full list:
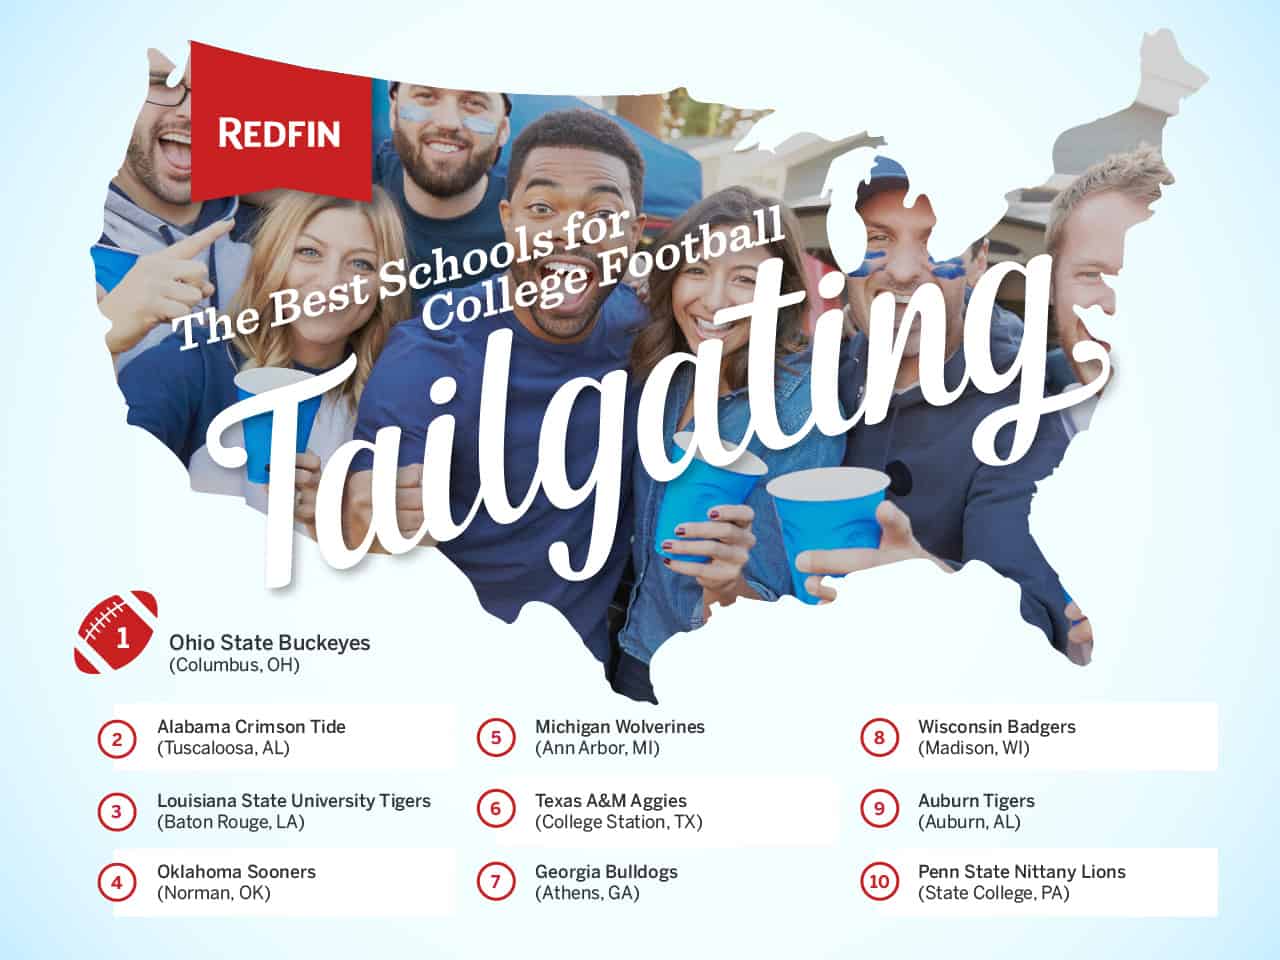
1. Ohio State Buckeyes
2016 Football Revenue: $86.6 million (9)
Stadium Capacity: Ohio Stadium (The Shoe) – 104,944 (3)
Win Percentage: 82.7% (2)
Walk Score: 41 (34)
Median Sale Price: $175,000 (10)
2. Alabama Crimson Tide
2016 Football Revenue: $103.9 million (3)
Stadium Capacity: Bryant Denny Stadium – 101,821 (7)
Win Percentage: 88.7% (1)
Walk Score: 33 (50)
Median Sale Price: $593,000 (59)
3. LSU Tigers
2016 Football Revenue: $85.7 million (10)
Stadium Capacity: Tiger Stadium – 102,321 (6)
Win Percentage: 76.7% (8)
Walk Score: 41 (35)
Median Sale Price: $199,000 (19)
4. Oklahoma Sooners
2016 Football Revenue: $94.1 million (6)
Stadium Capacity: Gaylord Family Oklahoma Memorial Stadium (Owen Field) – 82,112 (16)
Win Percentage: 79.3% (5)
Walk Score: 30 (57)
Median Sale Price: $212,000 (20)
5. Michigan Wolverines
2016 Football Revenue: $97.1 million (5)
Stadium Capacity: Michigan Stadium (The Big House) – 107,601 (1)
Win Percentage: 64.4% (23)
Walk Score: 51 (20)
Median Sale Price: 234,000 (24)
6. Texas A&M Aggies
2016 Football Revenue: $73.7 million (13)
Stadium Capacity: Kyle Field – 102,733 (4)
Win Percentage: 65.9% (18)
Walk Score: 33 (49)
Median Sale Price: 278,000 (33)
7. Georgia Bulldogs
2016 Football Revenue: $87.6 million (8)
Stadium Capacity: Sanford Stadium – 92,746 (10)
Win Percentage: 67.9% (15)
Walk Score: 71 (5)
Median Sale Price: $468,000 (53)
8. Wisconsin Badgers
Athletic Department Revenue: $71.2 million (14)
Stadium Capacity: Camp Randall – 80,321 (18)
Win Percentage: 74.7% (9)
Walk Score: 49 (26)
Median Sale Price: 195,000 (18)
9. Auburn Tigers
Athletic Department Revenue: $92.5 million (7)
Stadium Capacity: 87,451 (13)
Win Percentage: 65.2% (21)
Walk Score: 27 (61)
Median Sale Price: $240,000 (26)
10. Penn State Nittany Lions
2016 Football Revenue: $75.5 million (12)
Stadium Capacity: Beaver Stadium – 106,572 (2)
Win Percentage: 62.2% (26)
Walk Score: 24 (62)
Median Sale Price: 279,000 (34)
Methodology: Redfin analyzed the 65 college football teams that make up the power five conference which includes the ACC, Big 12, Big Ten, Pac-12 and SEC. Five metrics were used to calculate the ranking. Walk scores were provided by WalkScore.com. Metro median home sale price was gathered using Redfin data. Football program revenue was sourced from the U.S. Department of Education, Equity in Athletics Data Analysis website. Win percentages came from a database compiled by Stassen Statistics. Stadium capacity was taken from Wikipedia.
The final ranking was determined by ranking the 65 teams by each metric and then adding the totals to create a final ranking. Median home sale price was given a fourth of the weight of the other metrics.


