
Taxes are three-times lower in the top-10 migration destinations than in the 10 places people are most commonly leaving.
In the second quarter of 2018 people in expensive, high-tax coastal markets including San Francisco, New York, Los Angeles and Washington, D.C. searched for homes in metros like Phoenix, Las Vegas and Miami, where taxes are lower and housing is more affordable. The latest migration analysis is based on a sample of more than 1 million Redfin.com users who searched for homes across 80 metro areas from April to June.
Nationally, 24 percent of Redfin.com home searchers looked to move to another metro area in the second quarter, compared to 21 percent during the same period last year. According to Census survey data, housing-related reasons are the primary reason households relocate to another county, which in today’s market typically means affordability.
“With home prices reaching new heights in many metro areas, it’s no surprise people are continuing to move away from expensive metros in search of homeownership,” said Taylor Marr, Redfin senior economist. “Last year’s tax reform poured fuel on the fire. By capping mortgage interest and state and local tax deductions, there is an even greater incentive for homebuyers to consider moving to a lower-tax state.”
Tax Reform Is Accelerating Migration Trends
The trend of people leaving high-tax states for low-tax ones has been underway since 2010 and is accelerating, according to migration data from the Census Bureau. The chart below shows that Tennessee—the state with one of the lowest tax burdens—added about 70 new residents per day since 2010 (2.7% net growth rate from domestic migration). In contrast, the high-tax state of New Jersey had about 155 residents leave the state per day over the past seven years (4.4% net decline in state population due to migration to other states).
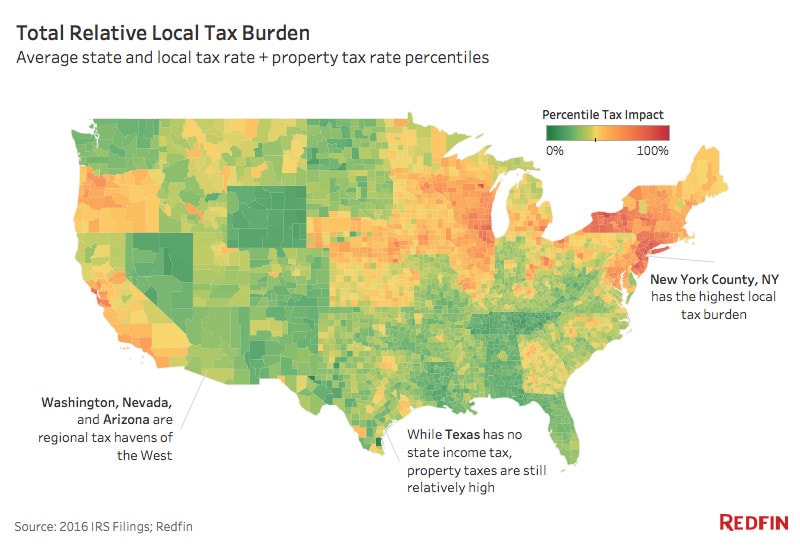
The average local tax burden—a relative measure of a county’s average sales, income, and property tax rates—was three-times lower in the top-10 migration destinations than in the 10 places people were most commonly leaving last quarter.
While taxes have long been part of the equation of where to live, tax reform passed in late 2017 has further heightened this consideration for homebuyers. According to a Redfin-commissioned survey in May 2018, which included responses from 1,300 people who had bought a home in the past year:
- 8% of people said they shifted their search to a state with lower taxes due to the new tax law.
- 9% said they shifted their search to nearby cities with lower taxes.
- 10% said they bought a less expensive home because of the decreased benefits on high-priced homes.
- 10% bought a more expensive home because their after-tax income grew.
“Now that homeowners and prospective buyers have had some time to understand how the new tax laws are affecting their finances, we are starting to see an impact on migration trends,” said Marr.
Moving Out – Metros with the Highest Net Outflow of Redfin Users
San Francisco, New York, Los Angeles, Washington, D.C. and Chicago posted the highest net outflows in the second quarter. Net outflow is defined as the number of people looking to leave the metro minus the number of people looking to move to the metro. A net outflow means there are more people looking to leave than people looking to move in, while a net inflow means more people are looking to move in than leave. These metros have consistently ranked as the highest net outflow metro areas since Redfin began tracking quarterly migration in early 2017. These trends appear to be accelerating as the share of residents looking to leave is rising.
Of all Bay Area residents using Redfin, 22 percent were searching for homes in another metro, up from 19 percent during the same time period a year earlier. Of New Yorkers, 36 percent looked to leave compared to 35 percent last year. Of Los Angelenos, 16 percent looked to leave, compared to 15 percent last year.
| Table: Top 10 Metros by Net Outflow of Users and Their Top Destinations | ||||||||
| Rank | Metro* | date | Net Outflow† | Net Outflow Last Year | Portion of Local Users Searching Elsewhere | Portion of Local Users Searching Elsewhere Last Year | Top Destination | Top Out-of-State Destination |
|---|---|---|---|---|---|---|---|---|
| 1 | San Francisco, CA | 2018-04-01 | 27,849 | 16,745 | 22.1% | 18.8% | Sacramento, CA | Seattle, WA |
| 2 | New York, NY | 2018-04-01 | 23,559 | 15,644 | 36.3% | 34.6% | Boston, MA | Boston, MA |
| 3 | Los Angeles, CA | 2018-04-01 | 13,370 | 13,109 | 15.5% | 14.7% | San Diego, CA | Phoenix, AZ |
| 4 | Washington, DC | 2018-04-01 | 5,900 | 5,499 | 10.0% | 10.5% | Philadelphia, PA | Philadelphia, PA |
| 5 | Chicago, IL | 2018-04-01 | 3,428 | 2,366 | 9.1% | 7.9% | Phoenix, AZ | Phoenix, AZ |
| 6 | Denver, CO | 2018-04-01 | 3,007 | 338 | 22.6% | 17.9% | Colorado Springs, CO | Seattle, WA |
| 7 | Milwaukee, WI | 2018-04-01 | 787 | 226 | 39.1% | 36.9% | Chicago, IL | Chicago, IL |
| 8 | Houston, TX | 2018-04-01 | 336 | 317 | 25.2% | 24.1% | Austin, TX | Chicago, IL |
| 9 | Eugene, OR | 2018-04-01 | 288 | -201 | 44.3% | 26.0% | Portland, OR | Seattle, WA |
| 10 | Detroit, MI | 2018-04-01 | 263 | 309 | 21.9% | 25.3% | Chicago, IL | Chicago, IL |
| *Combined statistical areas with at least 500 users in Q2 2018 †Among the one million users sampled for this analysis only |
||||||||
Denver: Reaching its Peak
Last quarter, we hypothesized that Denver had reached its peak in terms of migration, noting that the metro posted a net outflow of Redfin users for the first time. That trend continued in the second quarter. Of all Denverites using Redfin, 23 percent were searching for homes in another metro, up from 18 percent during the same time period a year earlier. Among the Denverites who were searching elsewhere, approximately 20 percent were looking at more affordable metros within the state: Colorado Springs and Fort Collins. The median list price in Colorado Springs and Fort Collins was $305,000 and $401,000 respectively, compared to Denver’s median list price of $406,000 in July.
Seattle: One to Watch
Seattle is an interesting case. In the first three quarters of 2017, Seattle drew new residents. In Q4 2017 and Q1 2018 that trend reversed and Seattle joined the list of metro areas with more people looking to leave than move in. In the second quarter, Seattle reversed course again with a net inflow of residents. The fact that Seattle residents don’t pay state income taxes may be one reason Seattle had a net inflow, despite its staggering home price growth, up 58 percent in the past five years. Another reason is the thriving tech sector, with Amazon, Google, Facebook and others continuing to grow and attract new hires to the region. We’ll continue following Seattle migration trends in future quarters to understand whether the metro is topping out on growth.
Moving In – Metros with the Highest Net Inflow of Redfin Users
The places attracting the most people are mostly sun-scorched metros with relatively affordable homes and lower tax burdens, including Phoenix, Las Vegas and Miami. Below are the 10 metros that are the most likely to receive big inflows of new residents in the coming year from expensive coastal markets. With these new residents, economic growth and rising home prices will likely follow.
| Table: Top 10 Metros by Net Inflow of Users and Their Top Origins | ||||||
| Rank | Metro* | Net Inflow† | Net Inflow LY | Portion of Searches from Users Outside the Metro | Top Origin | Top Out-of-State Origin |
|---|---|---|---|---|---|---|
| 1 | Phoenix, AZ | 6,349 | 3849 | 34.0% | Los Angeles, CA | Los Angeles, CA |
| 2 | Sacramento, CA | 6,208 | 4833 | 39.9% | San Francisco, CA | Seattle, WA |
| 3 | Atlanta, GA | 5,112 | 2767 | 26.7% | New York, NY | New York, NY |
| 4 | Las Vegas, NV | 3,786 | 3509 | 41.4% | Los Angeles, CA | Los Angeles, CA |
| 5 | Portland, OR | 3,614 | 1190 | 18.2% | San Francisco, CA | San Francisco, CA |
| 6 | Austin, TX | 3,212 | 1655 | 27.4% | San Francisco, CA | San Francisco, CA |
| 7 | Dallas, TX | 2,979 | 2036 | 22.3% | Los Angeles, CA | Los Angeles, CA |
| 8 | Miami, FL | 2,575 | 1746 | 24.2% | New York, NY | New York, NY |
| 9 | San Diego, CA | 2,537 | 5286 | 24.1% | Los Angeles, CA | Seattle, WA |
| 10 | Nashville, TN | 2,462 | 1364 | 33.6% | New York, NY | New York, NY |
| *Combined statistical areas with at least 500 users in Q2 2018 †Negative values indicate a net outflow; among the one million users sampled for this analysis only |
||||||
Phoenix and Las Vegas: Affordable Desert Oases
As in the first quarter, Phoenix again had the highest net inflow in the analysis. Thirty-four percent of home searchers in Phoenix in the second quarter were from elsewhere, up from 31 percent during the same period last year. The top origin of Phoenix migrants was Los Angeles (25% of inbound searches), followed by Seattle (14%), Chicago (8%), the Bay Area (8%) and New York (5%).
Phoenix is also much more affordable, with a median home list price of $275,000 in July, compared to $410,000 in Denver and $565,000 in Seattle.
Las Vegas, another low-tax haven, had the highest share of non-local searches. Forty-one percent of the people searching for homes in Las Vegas were searching from outside the metro area. Nearly 40 percent of these inbound searches originated in Los Angeles, followed by the San Francisco Bay Area (12%), Portland, Oregon (8%), and Seattle (5%). The influx of new residents to the area is causing prices and competition to accelerate. Median home prices in Las Vegas rose by 11 percent in July year over year, marking 17 months in a row of double-digit price growth.
“Affordability definitely plays a role in home searchers considering Las Vegas as their new home city,” said Nicole Lazarski, a Redfin agent in Las Vegas. “Even though home prices are climbing fast, they have still not returned to their 2007 height. With a median sale price around $270,000 in July, plus Nevada’s low property taxes and lack of a state income tax, it’s a very attractive place for people looking to leave California and other expensive places.”
In Las Vegas, the typical homeowner pays $1,500 (0.8%) in property taxes and about 8 percent in local sales taxes, with no state income tax, whereas in Los Angeles, the respective amounts are $3,600 (0.8%) property taxes, about 9 percent sales tax rate, and 8 percent state income tax rate.
Find Your City
Below is an interactive tool to see where people are looking to move and where people are coming from for 80 U.S. metros. Find your city by clicking on the drop down menu:

Methodology
Redfin analyzed a sample of more than 1 million Redfin.com users searching for homes across 75 metro areas from April through June 2018. Users must have viewed at least 10 listings during the quarter. We also excluded locations that in aggregate represented less than 20 percent of a user’s searches. We determined the home metro by mapping the user’s IP address of the most common location they searched from. If a user was searching in more than one metro, we accounted for the share of searches in each metro. Combined Statistical Areas (as defined here) must have had at least 500 users either searching from or in that metro during the quarter.
To calculate net inflow and outflow, we take the number of users looking to leave the metro area and subtract the number of users looking to move to the metro area from another metro area. For example, let’s say there are 3,000 people in Phoenix looking at homes outside of Phoenix. 10,000 people outside of Phoenix are looking at homes in Phoenix. More people are moving to Phoenix than moving away, giving Phoenix has a net inflow of 7,000. (10,000 – 3,000 = 7,000)
It’s worth noting that net inflow and outflow data does not account for Redfin’s market share or the population of metro areas. In metros where Redfin has a larger number of website visitors, we may have a higher volume of inbound and outbound searches than in metros that are smaller or where Redfin has a smaller user base. The U.S. Census Bureau measures net migration flows, which is a common practice when analyzing migratory patterns.


