Some Americans are pulling their homes off the market, while others are waiting longer to list or are lowering their expectations for what their houses can sell for. Meanwhile, video-chat tours are soaring in popularity.
The impacts of the coronavirus pandemic are rippling through to nearly every segment of the economy and the housing market is no exception. The outbreak has driven sudden changes in behavior among homebuyers and sellers in the United States, which now has more reported cases of COVID-19 than any other country in the world.
Here are 11 charts that show how the coronavirus pandemic is changing the housing market.
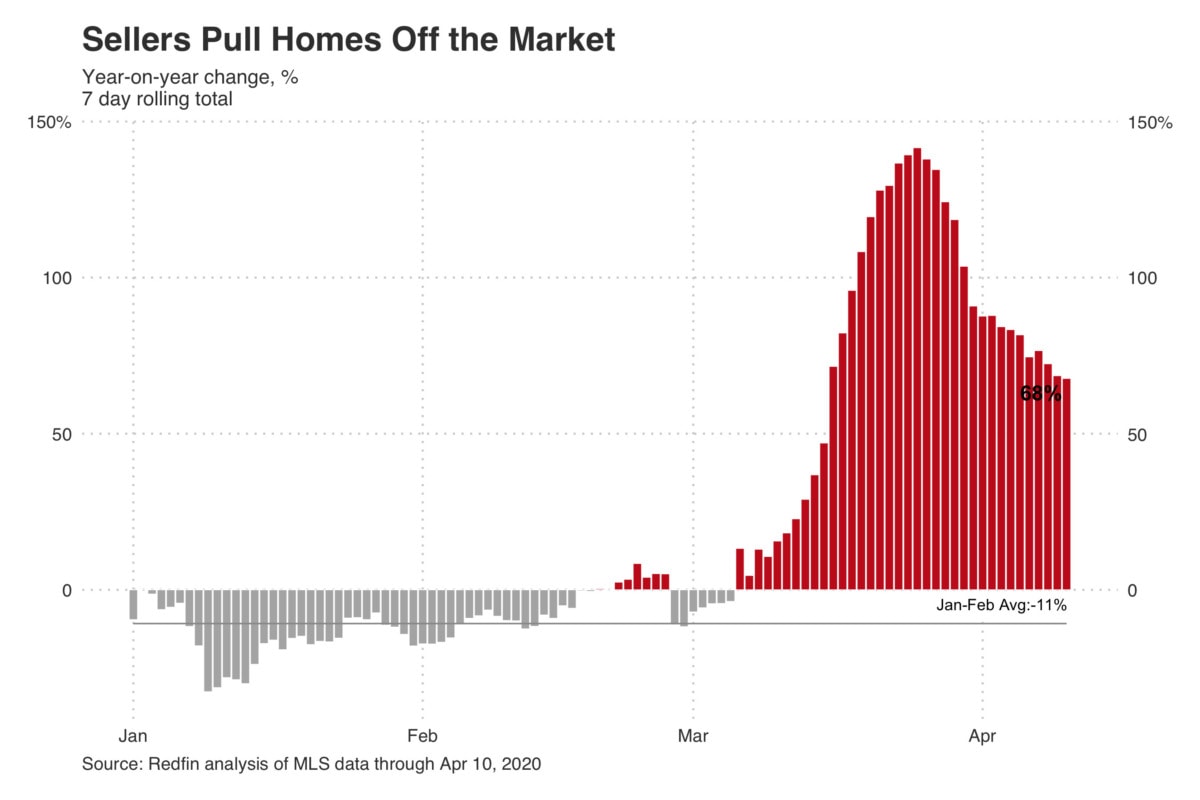
Home Delistings Are on the Rise
Supply is declining as Americans who had been planning to sell their homes are increasingly taking them off the market amid heightened economic uncertainty and record-high jobless claims. There was a 148% year-over-year increase in delistings during the week ending March 29, 2020, translating to a total of 28,140 homes. During that seven-day period, nearly 4% of homes were removed from the market, about twice the typical rate.
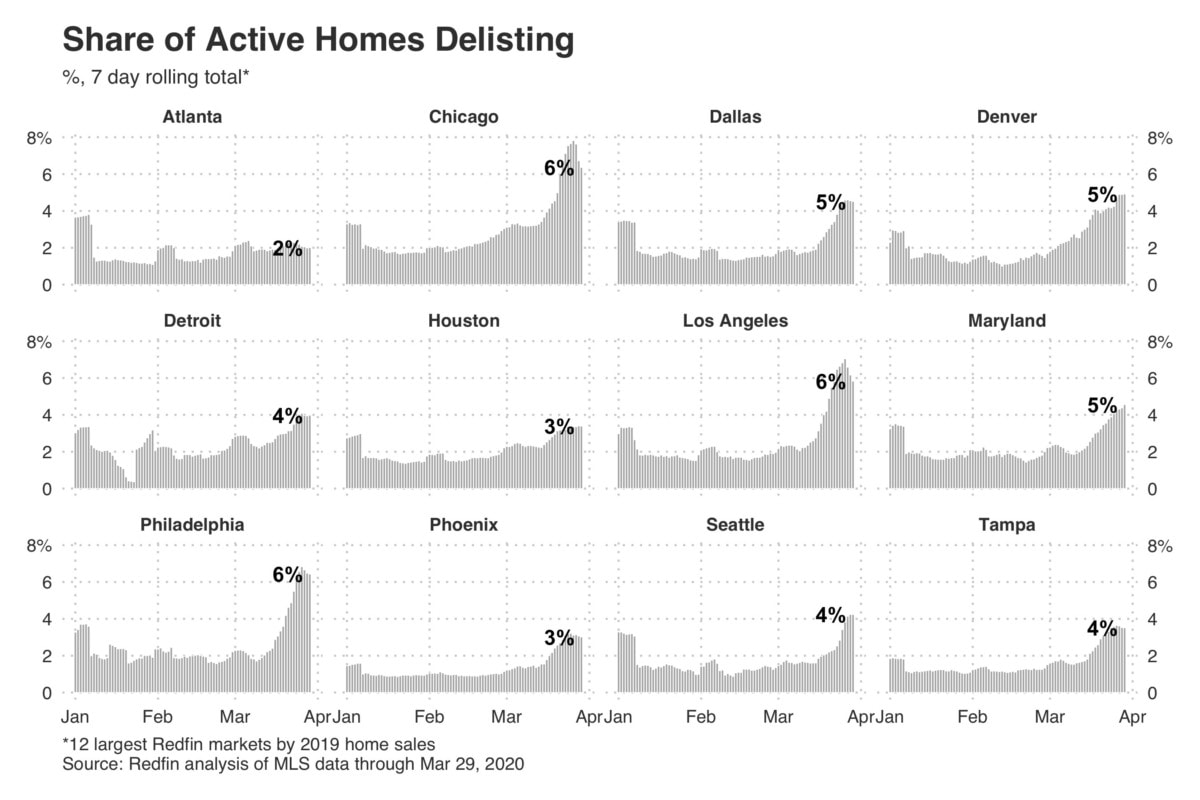
The change in delistings has varied by region. In Chicago, Los Angeles and Philadelphia, 6% of active listings were pulled off the market last week—double the national rate. These three markets tied for the largest share of delistings among the 12 U.S. markets with the most home sales. Dallas, Denver and Maryland came in second place, at 5%. Meanwhile, Atlanta saw a relatively low share of active homes delisted, at 2%.
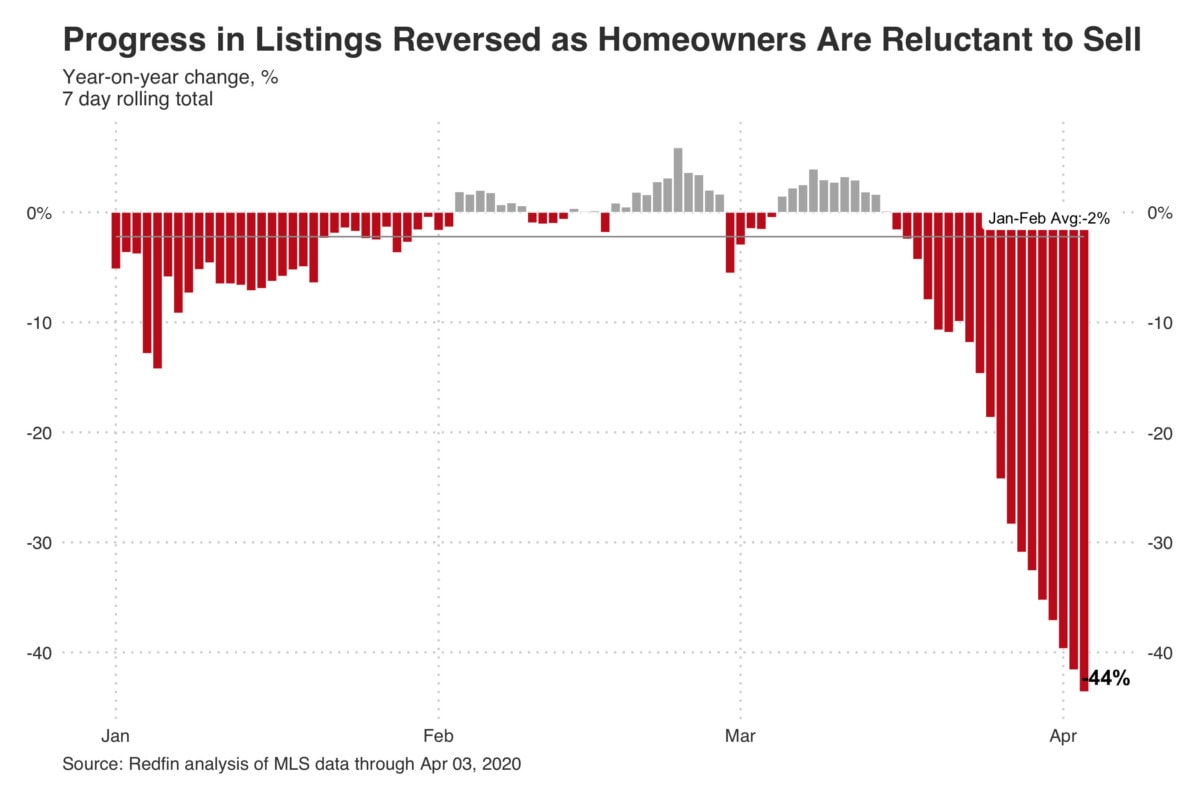
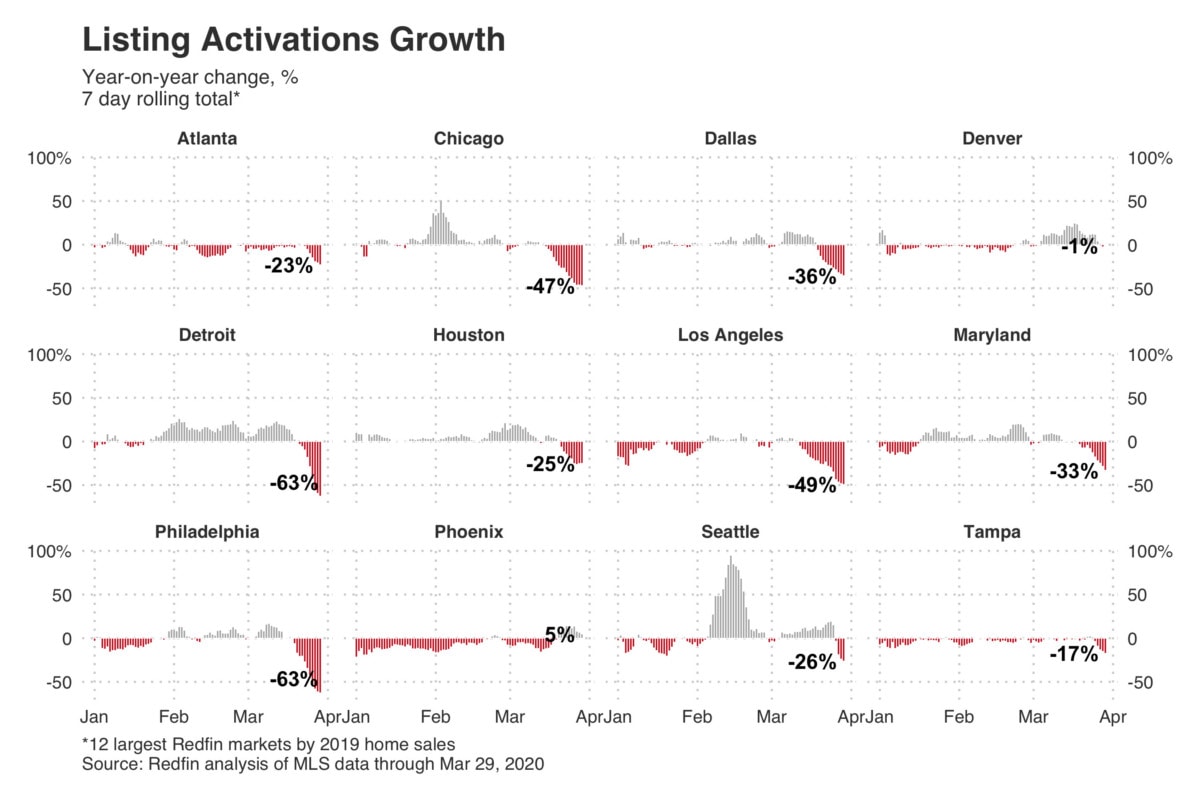
Listings of New Homes Are on the Decline
Earlier this month new-home listings, also known as listing activations, had been up slightly from the prior year, but that trend has reversed itself as homeowners have become increasingly hesitant to put their homes on the market. There were 58,366 new listings during the week ending March 29—a 33% drop from the prior year.
This metric also differed by market, with Detroit and Philadelphia seeing the biggest impact. New listings in both places slid 63% year-over-year last week—almost twice the national decline and the biggest drop among the 12 U.S. markets with the most home sales. By contrast, new listings only fell 1% in Denver, and remained positive in Phoenix.
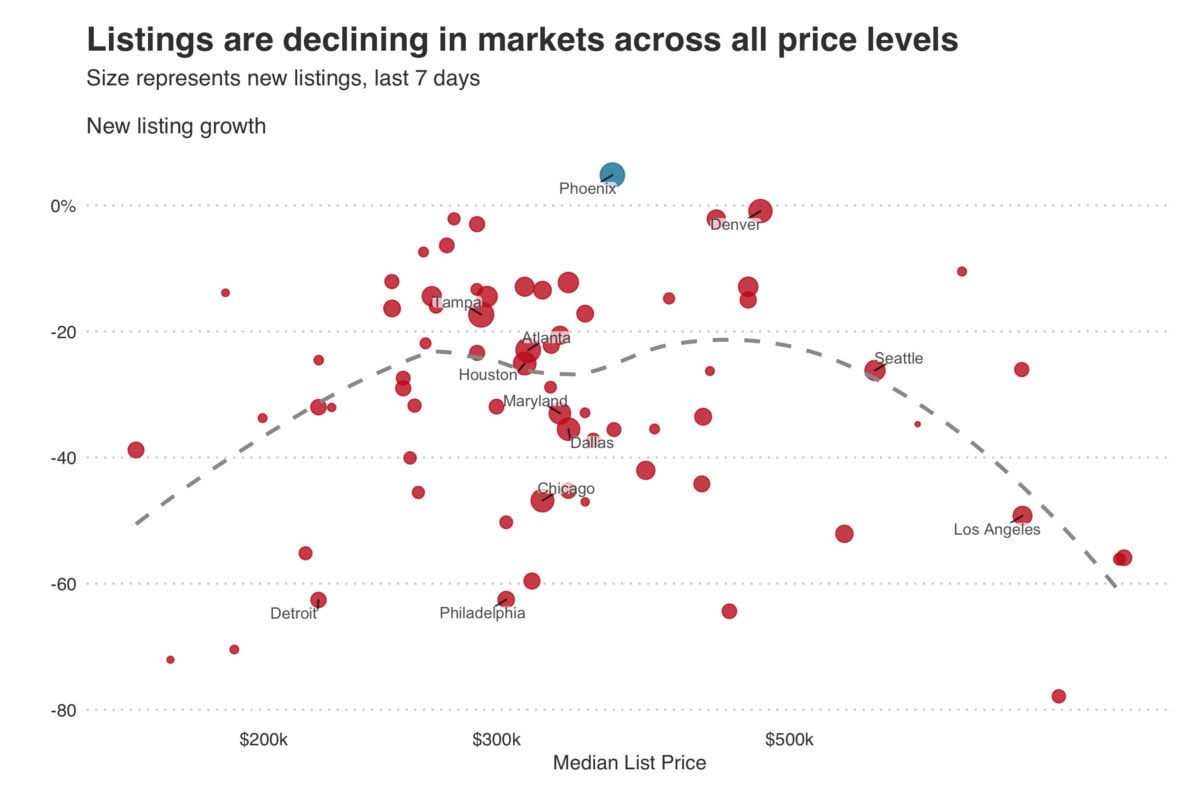
New listings are also on the decline across all price points:
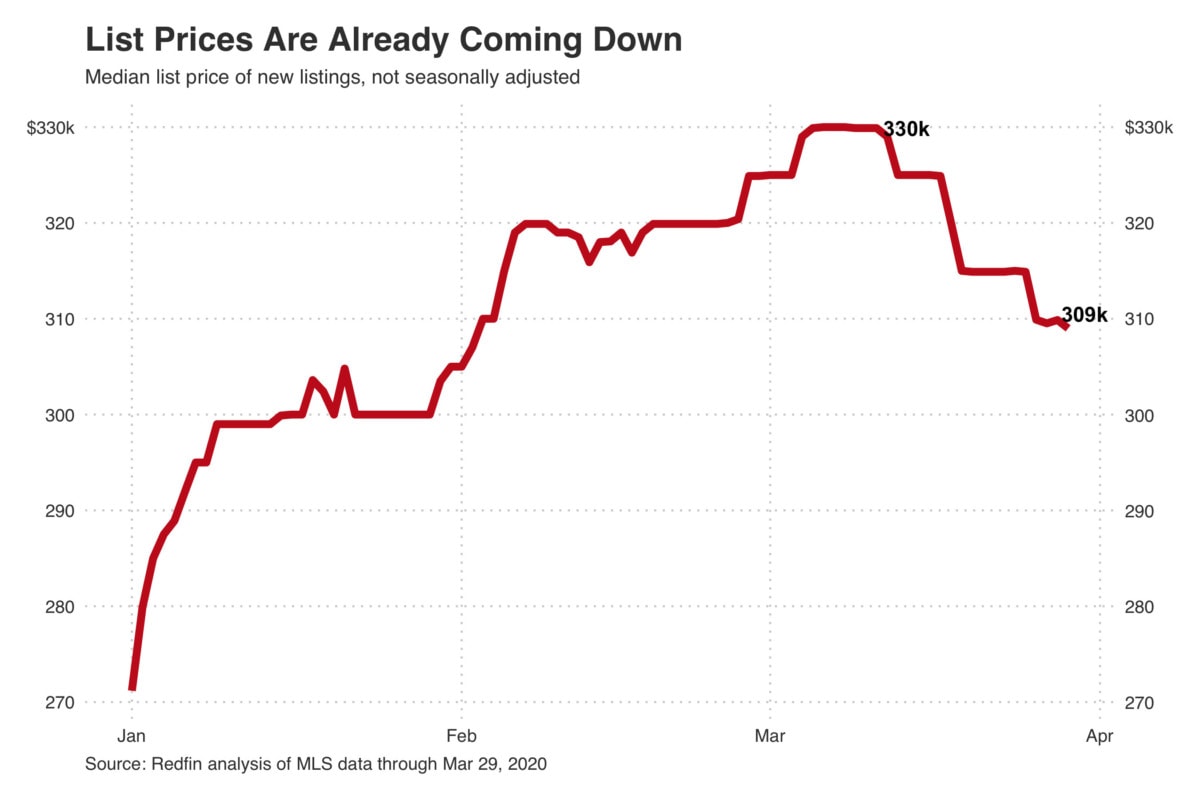
Listing Prices Are Starting to Slip
Americans who are still putting their homes up for sale are putting them on the market for less. The median asking price for newly-listed homes last week was $309,000—$21,000, lower than two weeks earlier. Similarly, price growth on a square-foot basis slowed to 3% from about 8% two weeks prior.
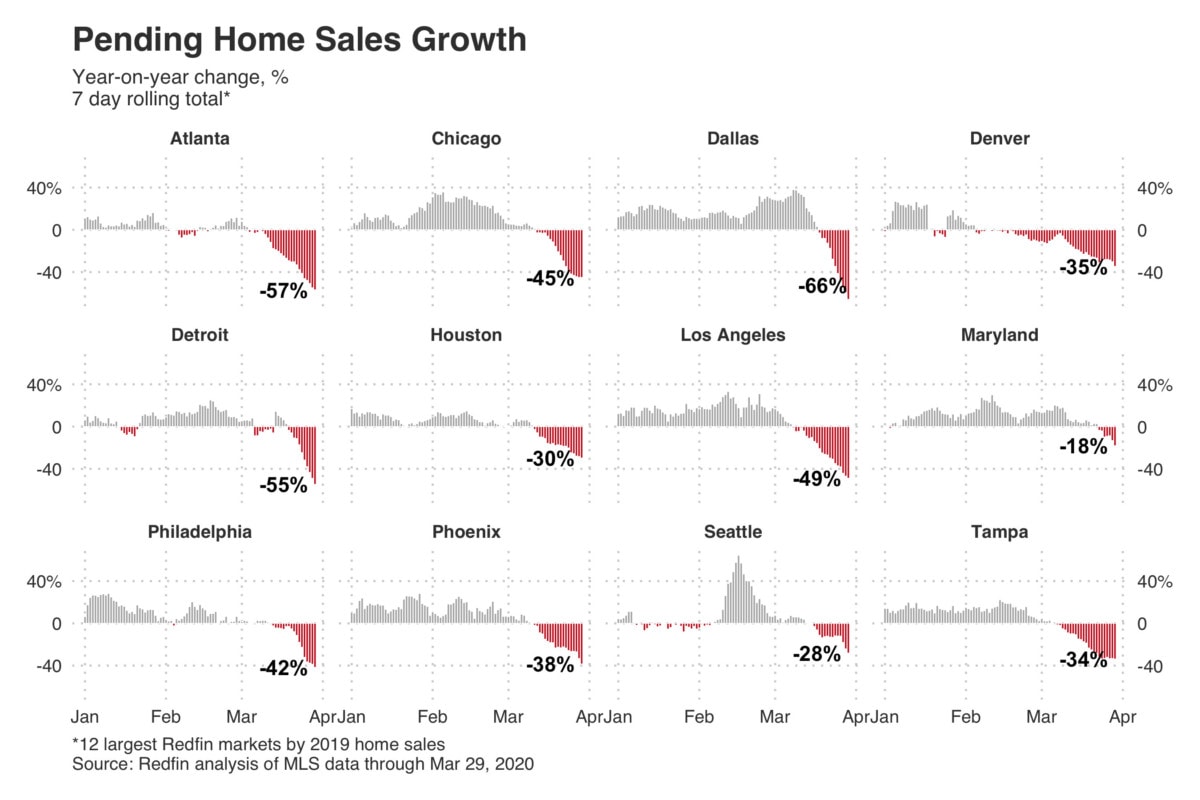
Pending Home Sales Are Falling
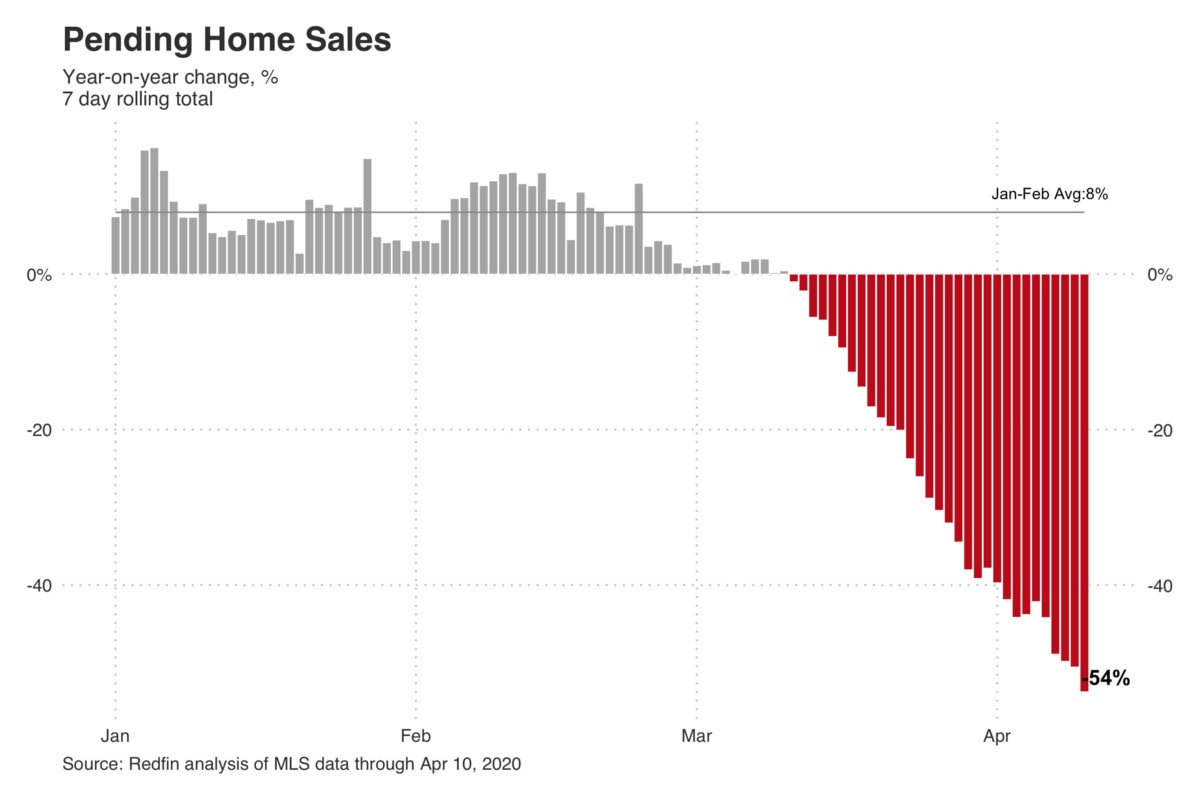
Pending home sales, or houses that are under contract, fell 42% from the previous year during the week ending March 29. Among large U.S. markets, Dallas saw the biggest decline (66%), followed by Atlanta (57%) and Detroit (55%). Maryland experienced the smallest decrease, with an 18% drop.
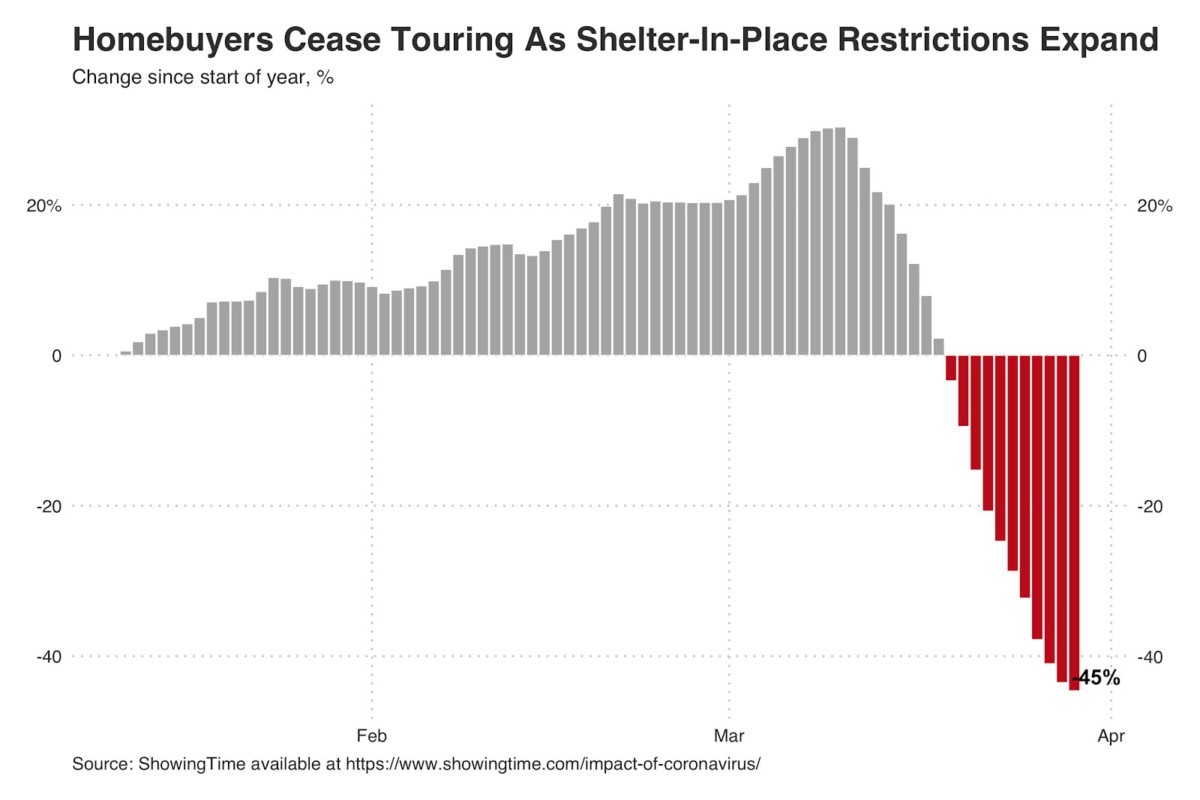
In-Person Home Tours Are Slowing
Home showings in North America were 45% lower last week than they were at the start of the year, according to data from ShowingTime, as Americans were urged to stay home to curb the spread of the coronavirus. That compares with a 35% increase during the same period in 2019, resulting in a total drop of about 80% year over year.
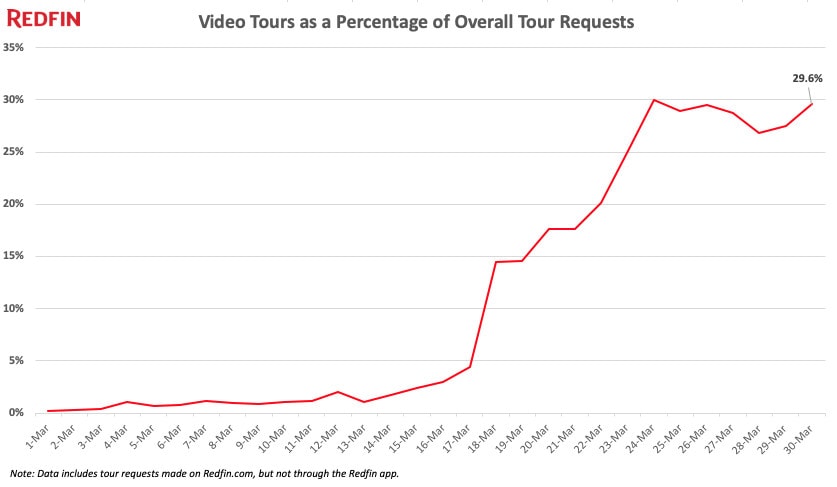
Video-Chat Tours Are Rising in Popularity
Redfin saw a 494% increase in requests for agent-led video home tours during the third week of March, following an 80% increase the prior week. As of March 30, about 30% of tour requests made on Redfin.com were video-chat tour requests, up from 0.2% at the beginning of March.
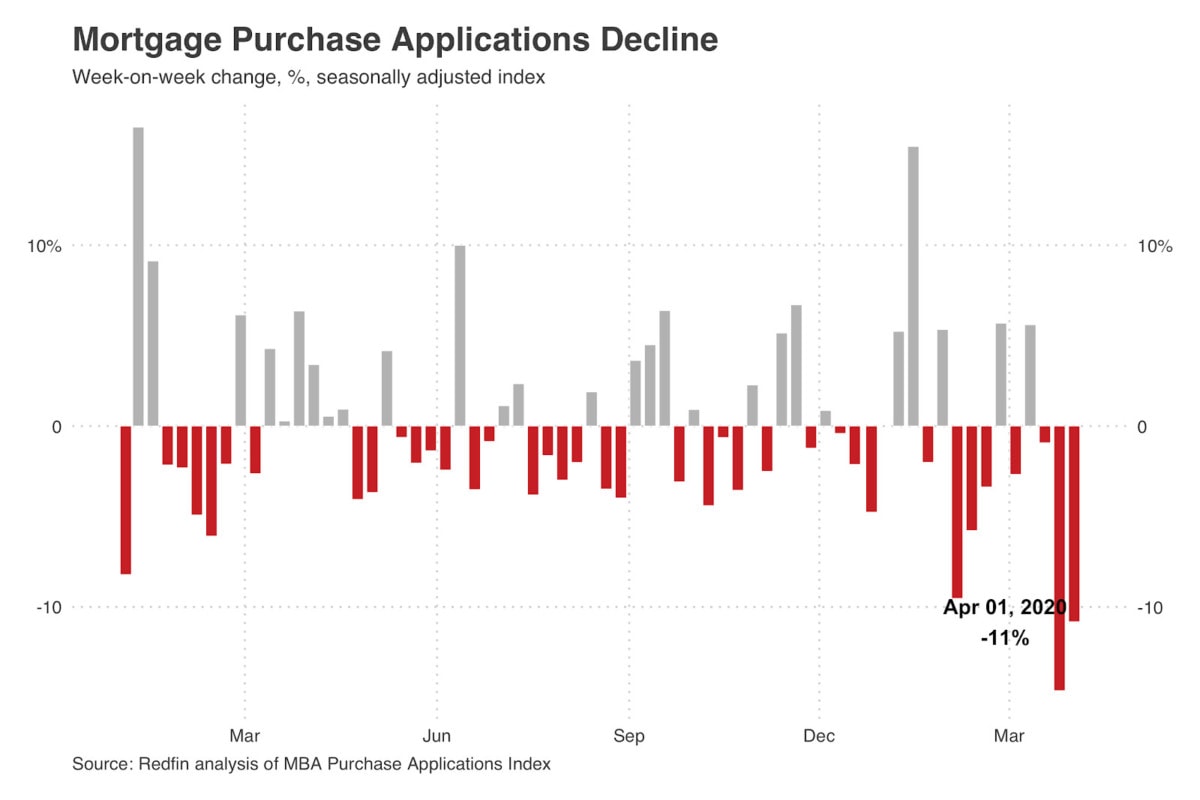
Mortgage Applications Are Dropping Off
Mortgage applications fell 11% week-over-week during the seven-day period ending March 27, according to the latest survey from the Mortgage Bankers Association. This is likely a result of the drop in homebuying demand due to heightened financial uncertainty, as well as higher mortgage rates as lenders continued to be overburdened by a flood of refinance applications, Redfin lead economist Taylor Marr said.