
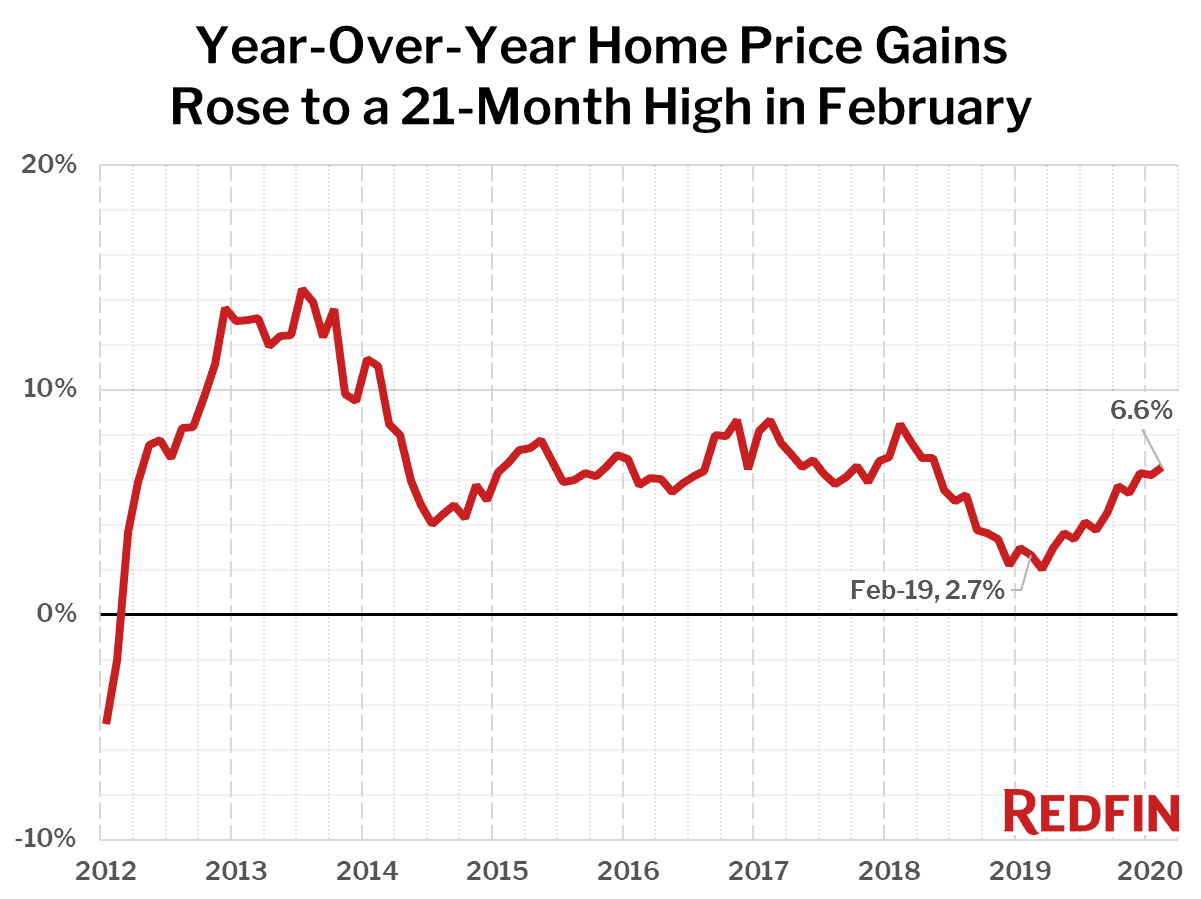
Home prices rose 7% in February from a year earlier, their largest gain in nearly two years, as the supply of homes for sale fell 8%.
During the month prior to the U.S. coronavirus crisis, U.S. home-sale prices increased 6.6% year over year. In February, the nationwide home price median rose to $293,700 and home prices were up 2.8% month over month on a seasonally-adjusted basis. While the U.S. economy and housing market is currently in great flux as a result of the COVID-19 pandemic, it’s important to look back at the February data to see how robust the market was heading into this crisis and to understand what we might return to when things—eventually—get back to “normal.”
Please note: In order to more accurately represent the national housing market trends and remove potential bias in the data due to Redfin’s market coverage, we made some changes to how we weight different regions and which counties we use as a representative sample for our national housing data methodology that is being rolled out with this report. The tables and historical charts in this post all reflect this new methodology and are therefore not comparable to our previous Market Tracker reports. You can read more details about our methodology change in this post.
| Market Summary | February 2020 | Month-Over-Month | Year-Over-Year |
|---|---|---|---|
| Median sale price | $293,700 | 1.6% | 6.6% |
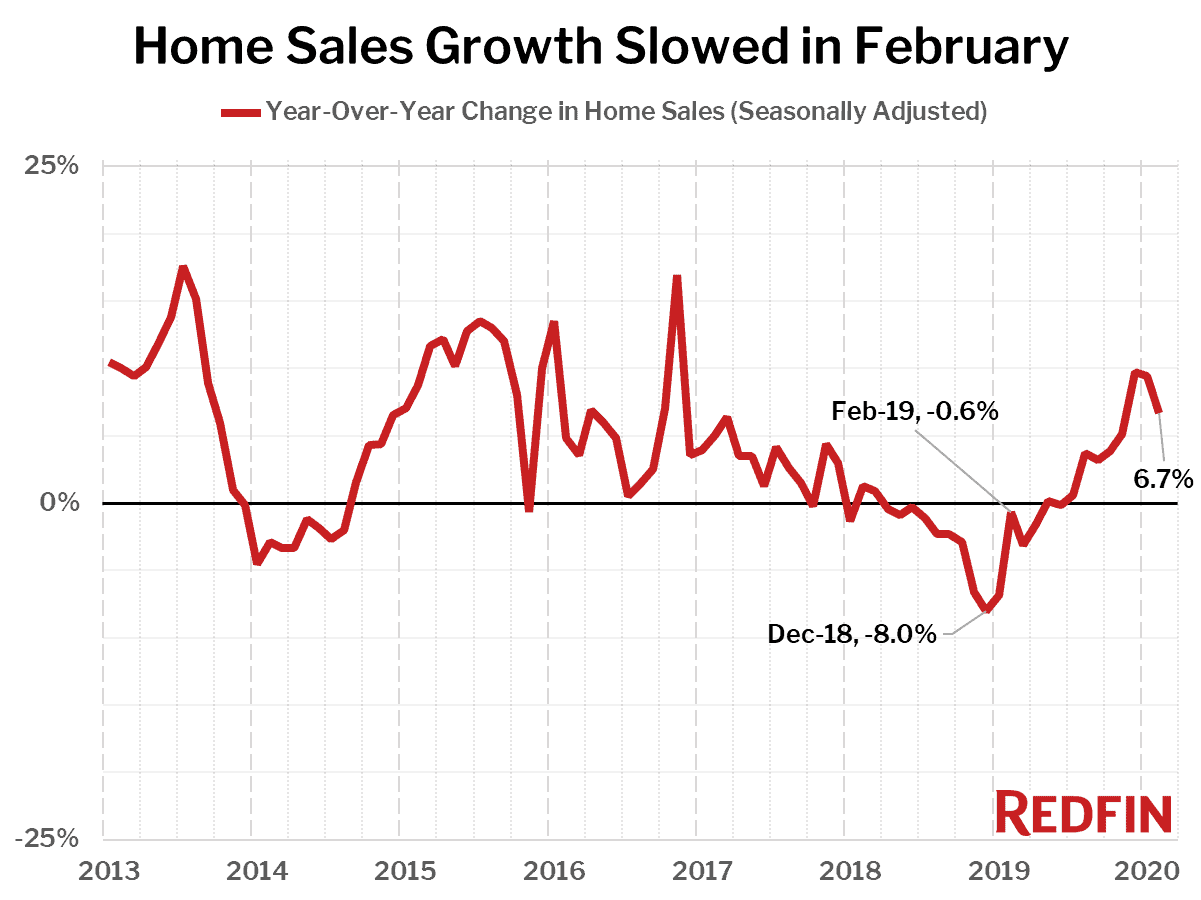
| Homes sold, seasonally-adjusted | 558,000 | 2.8% | 6.7% |
| New listings, seasonally-adjusted | 623,700 | 1.3% | 1.9% |
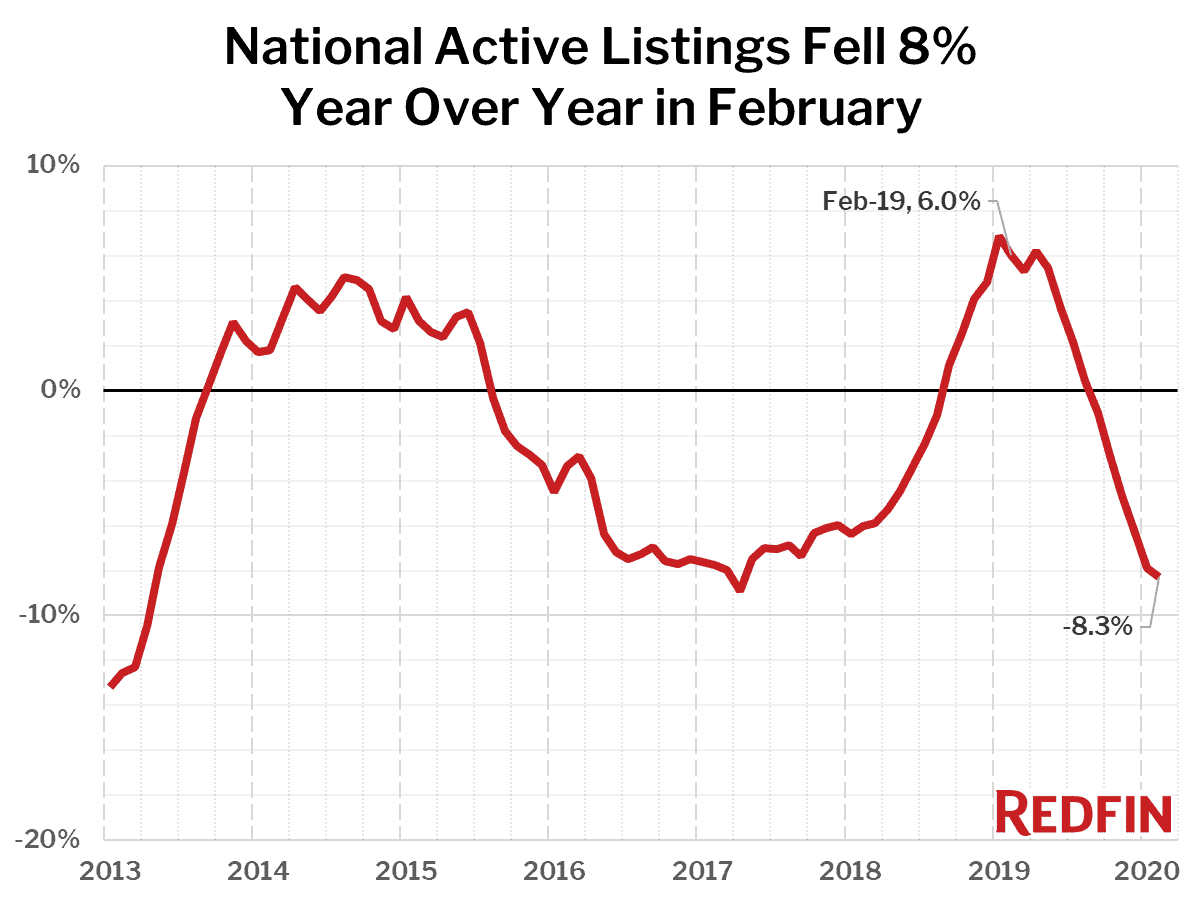
| All Homes for sale, seasonally-adjusted | 2,022,600 | -0.8% | -8.3% |
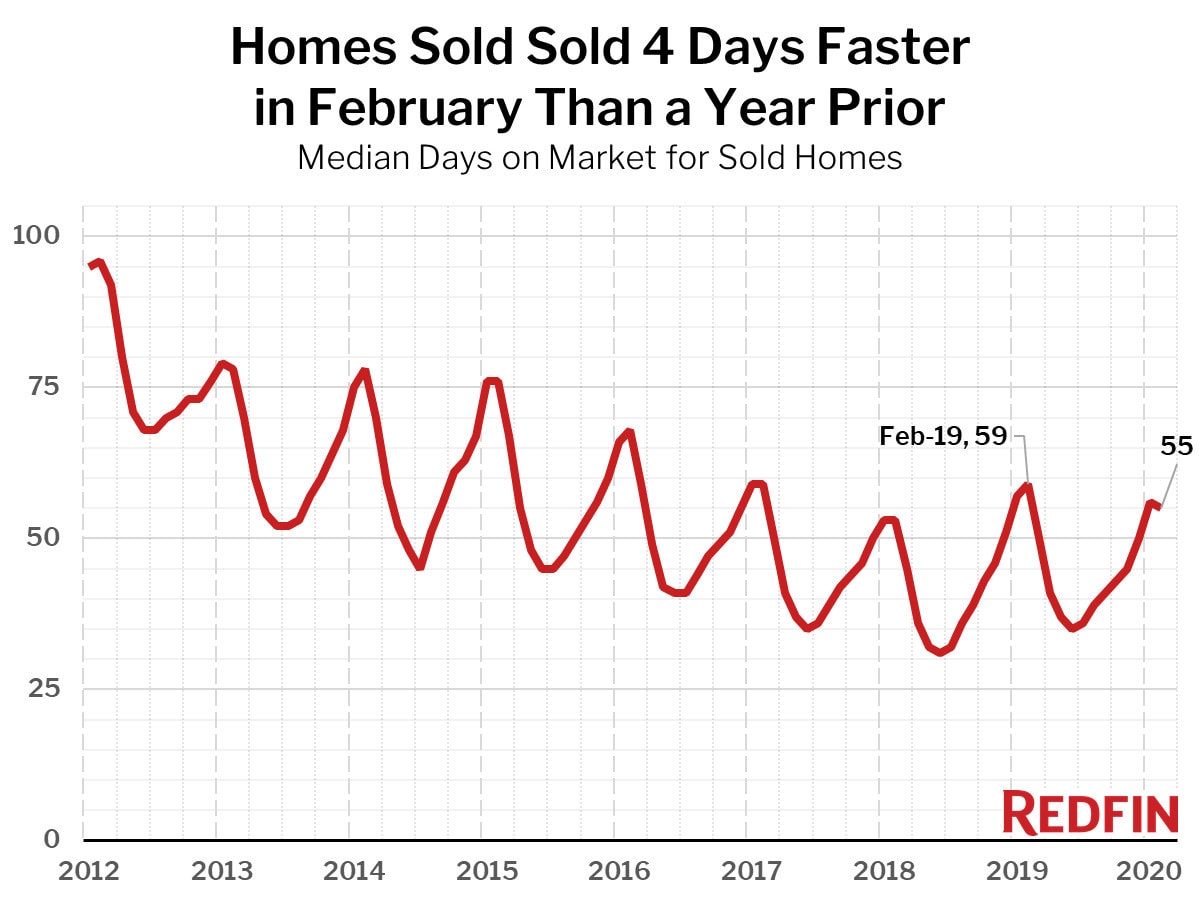
| Median days on market | 55 | -1 | -4 |
| Months of supply | 3.0 | -0.3 | -0.9 |
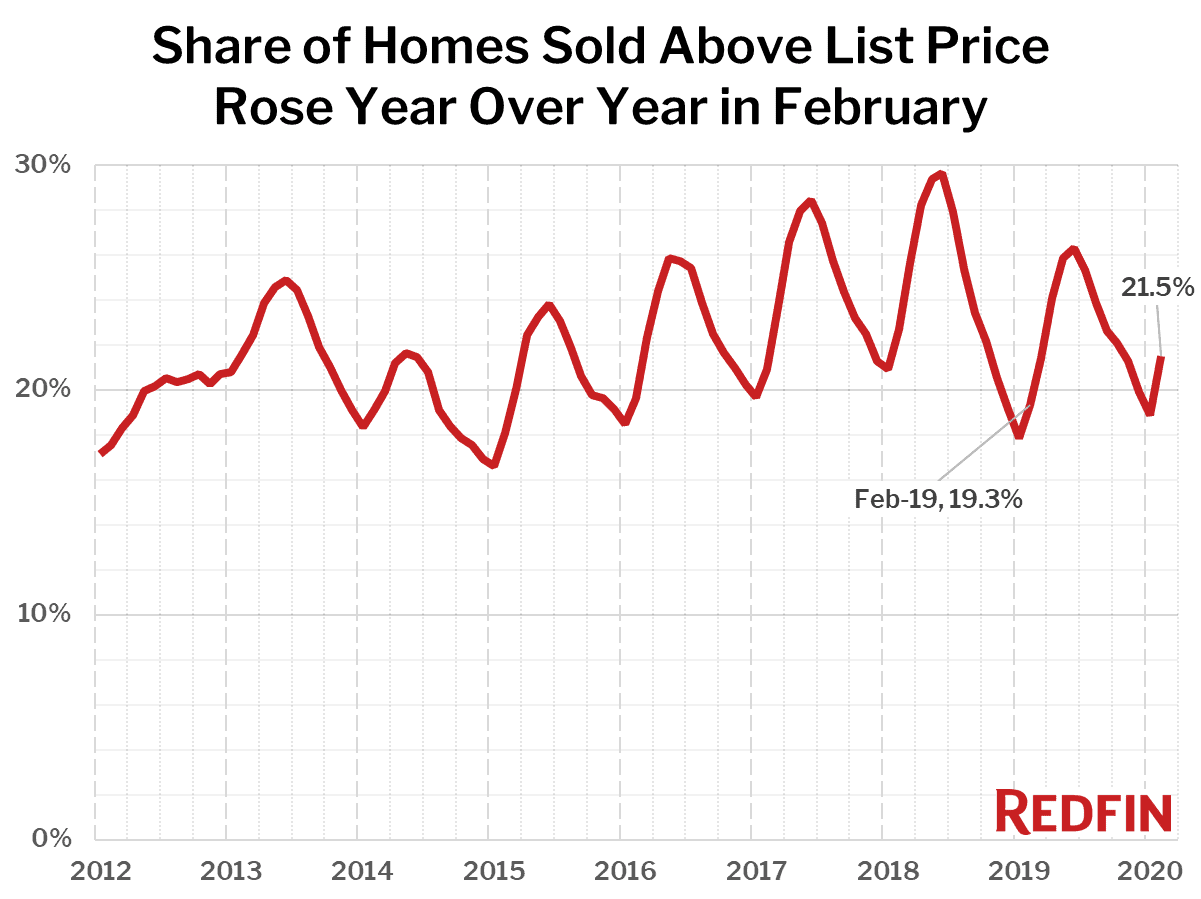
| Sold above list | 21.5% | 2.7 pts† | 2.2 pts† |
| Median Off-Market Redfin Estimate | $300,900 | 2.8% | 4.3% |
| Average Sale-to-list | 98.1% | 0.4 pts† | 0.3 pts† |
“The housing market was heating up quickly in February, resulting in a record low number of homes for sale before the coronavirus began its sudden impact on the U.S. economy in March,” said Redfin lead economist Taylor Marr. “Now, many buyers are putting their plans on hold. Buyers face uncertain economic times, whether because of job security or they’re relying on stocks for a downpayment. We’re currently expecting that, once the virus subsides, the housing market has the potential to rebound relatively quickly given how strong it looked going into this crisis.”
As in previous months, the biggest gains in home prices in February were in some of the most affordable housing markets in the nation. The five metro areas where home prices rose the most year-over-year all had median prices below the national level, led in February by Philadelphia, (median price $219,950, +18.9%), Knoxville, TN ($215,000, +14.4%) and McAllen, TX ($170,500, +14.2%).
Only two of the 85 largest metro areas Redfin tracks saw a year-over-year decline in the median sale price: Albany, NY (-2.4%) and New Haven, CT (-2.3%). Notably, home prices in San Jose, turned around, flipping from a 4.3% decrease in January to an increase of 5.7% in February.
Nationwide, home sales increased 6.7% year over year in February, the eighth consecutive month of increases, and were up 2.8% from January on a seasonally-adjusted basis. The markets with the biggest increases in home sales from a year ago were Anaheim, CA (31.5%), Las Vegas (23.1%) and Hartford, CT (18.3%).
The national count of active listings of homes for sale fell 8.3% year over year during February, the biggest drop since April 2017 and the sixth straight month of declines. There were fewer homes for sale last month than any time since at least January 2012, which is as far back as we have recorded this measure. Just six of the 85 largest metros tracked by Redfin posted a year-over-year increase in the count of seasonally-adjusted active listings of homes for sale, led by El Paso (+3.7%), Omaha (+3.2%) and Newark, NJ (+3.1%). Active listings is a count of all homes that were for sale at any time during the month.
Compared to a year ago, the biggest declines in active housing supply in February were in Allentown, PA (-41.5%).
The number of new listings edged up 1.9% in February from a year earlier, the first gain in 10 months.
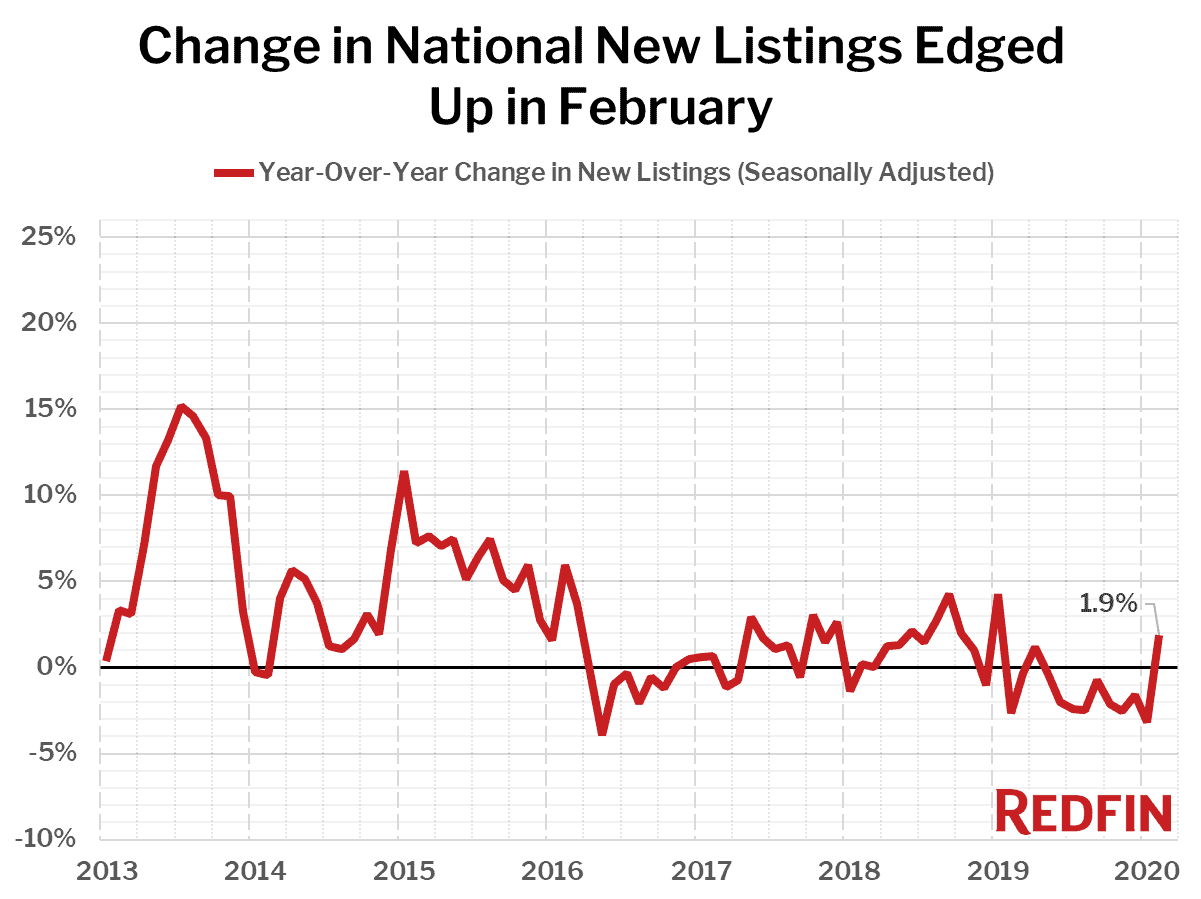
Seasonally-adjusted new listings in February fell the most from a year earlier in Allentown, PA (-42.0%).
Homes sold in February spent four fewer days on market compared to the prior year. In February, the typical home went under contract in 55 days, compared to 59 days in February 2019. If this measure increases due to the coronavirus market slowdown, we would not expect to see much change until April at the earliest, since most of the homes selling in March were under contract in February.
The share of homes that sold above list price increased 2.2 percentage points year over year, coming in at 21.5% in February compared to 19.3% a year earlier.
Other February Highlights
Competition
- Tacoma, WA was the fastest market, with half of all homes pending sale in just 13 days, down from 30 days a year earlier. San Jose, CA and Oakland, CA were the next fastest markets with 14 and 15 median days on market, followed by Seattle (16) and San Francisco (17).
- The most competitive market in February was San Francisco where 58.9% of homes sold above list price, followed by 58.2% in San Jose, CA, 55.0% in Oakland, CA, 49.3% in Tacoma, WA, and 39.5% in Los Angeles.
Prices
- Philadelphia had the nation’s highest price growth, rising 18.9% since last year to $219,950. Knoxville, TN had the second highest growth at 14.4% year-over-year price growth, followed by McAllen, TX (14.2%), Tulsa, OK (13.7%), and Camden, NJ (13%).
- 2 metros saw price declines in February including Albany, NY (-2.4%), and New Haven, CT (-2.3%).
Sales
- Anaheim, CA led the nation in year-over-year sales growth, up 31.5%, followed by Las Vegas, up 23.1%. Hartford, CT rounded out the top three with sales up 18.3% from a year ago.
- Miami saw the largest decline in sales since last year, falling 28.8%. Home sales in McAllen, TX and Tacoma, WA declined by 10.1% and 8.7%, respectively.
Inventory
- El Paso, TX had the highest increase in the number of homes for sale, up 3.7% year over year, followed by Omaha, NE (3.2%).
- Allentown, PA had the largest decrease in overall active listings, falling 41.5% since last February.
Redfin Estimate
- Miami (89.0%) had the largest share of homes predicted to sell for below list price, according to Redfin Estimate data, followed by Fort Lauderdale, FL (83.5%) and West Palm Beach, FL (82.3%).
- Oakland, CA (85.5%) had the largest share of homes predicted to sell at or above list price, followed by San Jose, CA (85.0%) and San Francisco (83.3%).
Below are market-by-market breakdowns for prices, inventory, new listings and sales for markets with populations of 750,000 or more. For downloadable data on all of the markets Redfin tracks, visit the Redfin Data Center.
Median Sale Price
| Redfin Metro | Median Sale Price | Month-Over-Month | Year-Over-Year |
|---|---|---|---|
| Albany, NY | $200,000 | -2.4% | -2.4% |
| Allentown, PA | $201,500 | 6.1% | 9.2% |
| Anaheim, CA | $748,000 | 0.4% | 10.2% |
| Atlanta, GA | $250,000 | 4.2% | 6.4% |
| Austin, TX | $328,000 | 5.8% | 11.2% |
| Bakersfield, CA | $252,000 | 5.9% | 9.3% |
| Baltimore, MD | $265,000 | 2.7% | 6.0% |
| Baton Rouge, LA | $204,400 | 4.6% | 4.8% |
| Birmingham, AL | $210,900 | 5.5% | 11.1% |
| Boston, MA | $491,200 | -2.7% | 8.4% |
| Bridgeport, CT | $360,000 | -6.5% | 8.8% |
| Buffalo, NY | $150,000 | -2.0% | 2.0% |
| Camden, NJ | $189,900 | 2.6% | 13.0% |
| Charlotte, NC | $265,000 | 3.9% | 10.9% |
| Chicago, IL | $243,500 | 3.6% | 4.4% |
| Cincinnati, OH | $177,000 | -1.7% | 2.0% |
| Cleveland, OH | $145,500 | -0.3% | 5.8% |
| Columbus, OH | $216,000 | 5.4% | 10.8% |
| Dallas, TX | $289,000 | 2.1% | 3.6% |
| Dayton, OH | $137,000 | 3.8% | 5.4% |
| Denver, CO | $425,000 | 2.4% | 6.2% |
| Detroit, MI | $130,000 | 4.1% | 4.0% |
| El Paso, TX | $167,000 | 3.1% | 4.2% |
| Elgin, IL | $217,000 | -3.6% | 2.8% |
| Fort Lauderdale, FL | $279,900 | 1.8% | 10.9% |
| Fort Worth, TX | $245,000 | 0.8% | 5.4% |
| Frederick, MD | $390,800 | -2.8% | 2.8% |
| Fresno, CA | $279,900 | -0.9% | 6.6% |
| Grand Rapids, MI | $214,900 | 7.5% | 11.8% |
| Greensboro, NC | $185,000 | 5.2% | 10.8% |
| Greenville, SC | $215,000 | 4.9% | 7.5% |
| Hartford, CT | $211,000 | -4.1% | 9.9% |
| Houston, TX | $246,000 | 4.7% | 6.0% |
| Indianapolis, IN | $189,900 | 5.8% | 9.8% |
| Jacksonville, FL | $240,000 | 2.6% | 6.7% |
| Kansas City, MO | $219,000 | 1.9% | 9.5% |
| Knoxville, TN | $215,000 | 3.4% | 14.4% |
| Lake County, IL | $225,000 | 3.7% | 5.4% |
| Las Vegas, NV | $295,000 | 3.5% | 7.3% |
| Los Angeles, CA | $635,000 | 0.0% | 5.7% |
| Louisville, KY | $191,000 | 4.4% | 4.4% |
| McAllen, TX | $170,500 | 4.1% | 14.2% |
| Memphis, TN | $182,000 | -0.7% | 7.1% |
| Miami, FL | $320,000 | 3.9% | 7.0% |
| Milwaukee, WI | $209,500 | -0.1% | 12.6% |
| Minneapolis, MN | $282,300 | 4.2% | 5.8% |
| Montgomery County, PA | $317,800 | -2.2% | 11.5% |
| Nashville, TN | $300,000 | 2.0% | 7.1% |
| Nassau County, NY | $455,000 | -0.7% | 4.6% |
| New Brunswick, NJ | $310,000 | -3.1% | 4.4% |
| New Haven, CT | $193,000 | -3.5% | -2.3% |
| New Orleans, LA | $225,000 | -1.7% | 9.2% |
| New York, NY | $510,000 | 1.0% | 6.2% |
| Newark, NJ | $350,000 | -2.8% | 7.7% |
| North Port, FL | $282,800 | -0.8% | 5.1% |
| Oakland, CA | $705,000 | 2.9% | 0.7% |
| Oklahoma City, OK | $186,000 | 5.7% | 6.3% |
| Omaha, NE | $205,000 | 3.3% | 6.2% |
| Orlando, FL | $265,000 | 1.9% | 6.0% |
| Oxnard, CA | $607,500 | -3.6% | 5.7% |
| Philadelphia, PA | $220,000 | 5.7% | 18.9% |
| Phoenix, AZ | $299,000 | 2.0% | 12.0% |
| Pittsburgh, PA | $160,000 | 0.0% | 3.9% |
| Portland, OR | $406,000 | 0.4% | 3.6% |
| Providence, RI | $283,800 | -3.8% | 10.4% |
| Raleigh, NC | $298,500 | 3.2% | 3.9% |
| Richmond, VA | $247,000 | -1.6% | 5.9% |
| Riverside, CA | $390,000 | 1.3% | 6.8% |
| Rochester, NY | $136,000 | -8.4% | 4.7% |
| Sacramento, CA | $418,000 | 4.5% | 7.2% |
| Salt Lake City, UT | $353,200 | 1.6% | 10.7% |
| San Antonio, TX | $235,000 | 5.0% | 6.1% |
| San Diego, CA | $600,000 | 0.2% | 7.3% |
| San Francisco, CA | $1,400,000 | 7.7% | 9.4% |
| San Jose, CA | $1,110,000 | 13.0% | 5.7% |
| Seattle, WA | $575,000 | 4.5% | 5.5% |
| St. Louis, MO | $172,000 | -3.3% | 4.9% |
| Tacoma, WA | $399,200 | 5.1% | 10.6% |
| Tampa, FL | $240,000 | 1.7% | 5.7% |
| Tucson, AZ | $237,500 | 3.7% | 9.8% |
| Tulsa, OK | $182,000 | 4.0% | 13.7% |
| Urban Honolulu, HI | $599,600 | 0.7% | 10.7% |
| Virginia Beach, VA | $235,000 | 2.2% | 5.7% |
| Warren, MI | $210,000 | 1.3% | 7.7% |
| Washington, DC | $415,000 | 4.5% | 7.5% |
| West Palm Beach, FL | $290,000 | 2.7% | 8.2% |
| Worcester, MA | $255,000 | -7.8% | 5.2% |
| National | $293,700 | 1.6% | 6.6% |
Homes Sold
| Redfin Metro | Homes Sold, seasonally adjusted | Month-Over-Month | Year-Over-Year |
|---|---|---|---|
| Albany, NY | 863 | 0.8% | 1.4% |
| Allentown, PA | 942 | 14.4% | 5.7% |
| Anaheim, CA | 2,853 | 9.1% | 30.7% |
| Atlanta, GA | 9,528 | -0.2% | 6.9% |
| Austin, TX | 3,083 | -1.9% | 2.1% |
| Bakersfield, CA | 747 | 1.0% | 5.1% |
| Baltimore, MD | 3,728 | -1.9% | 7.5% |
| Baton Rouge, LA | 864 | -6.5% | -1.9% |
| Birmingham, AL | 1,375 | -2.6% | 0.2% |
| Boston, MA | 4,337 | 1.4% | -3.7% |
| Bridgeport, CT | 1,045 | 0.5% | 8.4% |
| Buffalo, NY | 1,019 | -2.1% | 6.3% |
| Camden, NJ | 1,744 | 2.2% | -1.7% |
| Charlotte, NC | 3,969 | 2.2% | 8.6% |
| Chicago, IL | 8,185 | 0.6% | 4.2% |
| Cincinnati, OH | 2,730 | 5.3% | 3.2% |
| Cleveland, OH | 2,655 | 6.4% | 12.3% |
| Columbus, OH | 2,786 | 3.3% | 9.8% |
| Dallas, TX | 5,975 | -1.8% | 10.8% |
| Dayton, OH | 1,070 | 4.0% | 9.6% |
| Denver, CO | 4,926 | 3.3% | 5.6% |
| Detroit, MI | 1,821 | 3.6% | 4.8% |
| El Paso, TX | 746 | -4.3% | 7.5% |
| Elgin, IL | 967 | -0.5% | 4.3% |
| Fort Lauderdale, FL | 2,806 | -1.9% | -2.9% |
| Fort Worth, TX | 2,875 | 0.2% | -0.6% |
| Frederick, MD | 1,643 | 6.1% | 14.9% |
| Fresno, CA | 781 | 1.1% | 11.4% |
| Grand Rapids, MI | 1,390 | 1.3% | 9.6% |
| Greensboro, NC | 836 | -0.6% | -0.5% |
| Greenville, SC | 1,204 | 11.9% | 0.9% |
| Hartford, CT | 1,391 | 1.0% | 10.6% |
| Houston, TX | 7,949 | 0.5% | 8.6% |
| Indianapolis, IN | 3,060 | 4.8% | 6.8% |
| Jacksonville, FL | 2,647 | 2.3% | 9.0% |
| Kansas City, MO | 3,060 | 5.3% | 4.8% |
| Knoxville, TN | 1,180 | -7.6% | 0.9% |
| Lake County, IL | 1,112 | -1.7% | 6.1% |
| Las Vegas, NV | 3,808 | 2.2% | 21.8% |
| Los Angeles, CA | 6,083 | 2.2% | 12.2% |
| Louisville, KY | 1,329 | 4.6% | 1.1% |
| McAllen, TX | 262 | -13.5% | -10.2% |
| Memphis, TN | 1,082 | -4.7% | -8.2% |
| Miami, FL | 1,899 | -25.7% | -22.7% |
| Milwaukee, WI | 1,810 | -0.5% | 1.4% |
| Minneapolis, MN | 5,345 | 3.1% | 5.4% |
| Montgomery County, PA | 2,390 | 6.1% | 4.9% |
| Nashville, TN | 3,618 | 2.7% | 10.1% |
| Nassau County, NY | 2,722 | -1.9% | 6.1% |
| New Brunswick, NJ | 3,246 | 2.7% | 9.4% |
| New Haven, CT | 938 | 0.0% | 11.4% |
| New Orleans, LA | 1,259 | -1.5% | 0.5% |
| New York, NY | 4,503 | -0.7% | -0.6% |
| Newark, NJ | 2,198 | -2.4% | 4.3% |
| North Port, FL | 2,041 | -1.0% | 12.9% |
| Oakland, CA | 2,248 | 3.1% | -0.4% |
| Oklahoma City, OK | 1,970 | 1.7% | 5.8% |
| Omaha, NE | 1,202 | 6.7% | 3.7% |
| Orlando, FL | 3,986 | -2.6% | 3.1% |
| Oxnard, CA | 734 | 1.0% | 6.1% |
| Philadelphia, PA | 2,337 | 3.5% | 12.5% |
| Phoenix, AZ | 8,826 | 4.0% | 16.9% |
| Pittsburgh, PA | 2,233 | 5.9% | 4.9% |
| Portland, OR | 3,383 | 1.3% | 7.5% |
| Providence, RI | 1,925 | 5.4% | 7.2% |
| Raleigh, NC | 2,555 | 2.1% | 11.0% |
| Richmond, VA | 1,740 | 8.1% | 12.3% |
| Riverside, CA | 4,990 | 1.4% | 11.6% |
| Rochester, NY | 1,033 | -4.0% | -2.6% |
| Sacramento, CA | 2,591 | 0.2% | -3.1% |
| Salt Lake City, UT | 1,574 | 6.4% | -1.3% |
| San Antonio, TX | 2,816 | -0.9% | -0.6% |
| San Diego, CA | 3,141 | 0.9% | 9.1% |
| San Francisco, CA | 918 | -0.9% | 0.0% |
| San Jose, CA | 1,212 | 4.1% | 4.7% |
| Seattle, WA | 3,975 | 0.2% | -0.2% |
| St. Louis, MO | 3,554 | 4.3% | 1.1% |
| Tacoma, WA | 1,224 | -2.8% | -8.9% |
| Tampa, FL | 5,599 | 2.9% | 5.5% |
| Tucson, AZ | 1,586 | 3.3% | 15.7% |
| Tulsa, OK | 1,148 | -2.5% | 1.6% |
| Urban Honolulu, HI | 777 | -0.7% | 5.3% |
| Virginia Beach, VA | 2,322 | 6.2% | 6.1% |
| Warren, MI | 3,474 | -2.7% | -0.7% |
| Washington, DC | 6,269 | 3.7% | 6.2% |
| West Palm Beach, FL | 2,838 | 0.8% | 5.3% |
| Worcester, MA | 1,061 | 0.2% | -2.5% |
| National | 558,000 | 2.8% | 6.7% |
New Listings
| Redfin Metro | New Listings, seasonally adjusted | Month-Over-Month | Year-Over-Year |
|---|---|---|---|
| Albany, NY | 1,015 | -2.2% | 9.6% |
| Allentown, PA | 721 | -9.0% | -31.2% |
| Anaheim, CA | 2,927 | 2.5% | 3.3% |
| Atlanta, GA | 9,747 | -5.7% | -8.2% |
| Austin, TX | 3,455 | -0.9% | 2.6% |
| Bakersfield, CA | 869 | 4.6% | -2.8% |
| Baltimore, MD | 4,295 | 3.1% | 2.9% |
| Baton Rouge, LA | 789 | -10.6% | -28.9% |
| Birmingham, AL | 1,316 | -5.3% | -12.0% |
| Boston, MA | 5,010 | 4.0% | 1.1% |
| Bridgeport, CT | 1,498 | 13.0% | 13.1% |
| Buffalo, NY | 1,166 | -5.9% | 10.2% |
| Camden, NJ | 1,856 | -1.3% | -6.1% |
| Charlotte, NC | 4,242 | 0.6% | 4.2% |
| Chicago, IL | 10,870 | 0.0% | 4.2% |
| Cincinnati, OH | 2,860 | -3.0% | -2.4% |
| Cleveland, OH | 2,783 | -2.4% | -5.0% |
| Columbus, OH | 2,734 | -6.0% | 2.7% |
| Dallas, TX | 7,351 | 1.7% | 3.4% |
| Dayton, OH | 1,151 | -0.9% | 10.1% |
| Denver, CO | 5,115 | -0.1% | -3.4% |
| Detroit, MI | 2,467 | 5.7% | 8.2% |
| El Paso, TX | 910 | -12.2% | 7.5% |
| Elgin, IL | 1,231 | 0.2% | 10.0% |
| Fort Lauderdale, FL | 3,254 | -4.5% | -19.8% |
| Fort Worth, TX | 3,584 | 2.1% | 1.6% |
| Frederick, MD | 1,781 | 2.5% | 15.5% |
| Fresno, CA | 810 | 1.7% | -4.9% |
| Grand Rapids, MI | 1,503 | 3.3% | 11.4% |
| Greensboro, NC | 650 | -6.4% | -26.9% |
| Greenville, SC | 1,200 | -2.9% | -0.1% |
| Hartford, CT | 1,768 | 1.2% | 13.3% |
| Houston, TX | 10,130 | 1.2% | 5.8% |
| Indianapolis, IN | 2,940 | -1.5% | 7.6% |
| Jacksonville, FL | 2,779 | -3.9% | -4.3% |
| Knoxville, TN | 1,104 | -7.6% | -17.4% |
| Lake County, IL | 1,461 | -0.1% | 7.9% |
| Las Vegas, NV | 3,804 | 3.6% | -7.6% |
| Los Angeles, CA | 6,958 | 3.9% | 1.9% |
| Louisville, KY | 1,520 | 1.0% | 8.9% |
| McAllen, TX | 476 | 0.6% | 7.7% |
| Memphis, TN | 1,167 | -7.7% | -10.3% |
| Miami, FL | 3,591 | -1.7% | -14.3% |
| Milwaukee, WI | 1,951 | 3.9% | 10.8% |
| Minneapolis, MN | 5,702 | 0.5% | 19.0% |
| Montgomery County, PA | 2,671 | 6.0% | 11.0% |
| Nashville, TN | 4,120 | 0.0% | 6.8% |
| Nassau County, NY | 3,343 | -0.1% | -1.5% |
| New Brunswick, NJ | 3,955 | 2.7% | 2.0% |
| New Haven, CT | 1,172 | 3.2% | 10.1% |
| New Orleans, LA | 1,399 | -6.2% | -8.8% |
| New York, NY | 7,756 | 0.6% | 0.2% |
| Newark, NJ | 2,752 | 1.3% | 3.7% |
| North Port, FL | 2,209 | -1.7% | -2.3% |
| Oakland, CA | 2,553 | 4.4% | -2.1% |
| Oklahoma City, OK | 2,258 | -0.5% | 9.5% |
| Omaha, NE | 1,326 | 8.7% | 22.5% |
| Orlando, FL | 4,439 | 1.5% | -2.8% |
| Oxnard, CA | 790 | -3.7% | 0.1% |
| Philadelphia, PA | 2,749 | -0.4% | 3.0% |
| Phoenix, AZ | 8,162 | 1.9% | -5.5% |
| Pittsburgh, PA | 2,570 | 1.4% | 7.0% |
| Portland, OR | 3,641 | 0.1% | 6.7% |
| Providence, RI | 2,196 | -0.3% | 0.2% |
| Raleigh, NC | 2,580 | -4.2% | 8.1% |
| Richmond, VA | 1,781 | -1.9% | 4.3% |
| Riverside, CA | 5,501 | 1.9% | 0.9% |
| Rochester, NY | 1,206 | 2.5% | 6.1% |
| Sacramento, CA | 3,134 | 2.9% | 7.1% |
| Salt Lake City, UT | 1,175 | -12.0% | -33.1% |
| San Antonio, TX | 3,307 | 2.2% | -2.5% |
| San Diego, CA | 3,412 | 2.1% | 2.0% |
| San Francisco, CA | 1,169 | 15.3% | 16.8% |
| San Jose, CA | 1,403 | 4.8% | -0.7% |
| Seattle, WA | 4,381 | 2.6% | 21.5% |
| St. Louis, MO | 2,417 | -25.6% | -35.6% |
| Tacoma, WA | 1,497 | 12.0% | 18.9% |
| Tampa, FL | 5,889 | -0.3% | -5.5% |
| Tucson, AZ | 1,628 | 1.6% | 2.3% |
| Urban Honolulu, HI | 874 | 6.8% | -9.4% |
| Virginia Beach, VA | 2,499 | -1.2% | 0.0% |
| Warren, MI | 4,201 | 4.6% | 8.5% |
| Washington, DC | 6,965 | 0.1% | 4.9% |
| West Palm Beach, FL | 3,635 | 2.7% | 0.3% |
| Worcester, MA | 1,287 | 3.8% | 16.2% |
| National | 623,700 | 1.3% | 1.9% |
All Homes for Sale
| Redfin Metro | All Homes for Sale, seasonally adjusted | Month-Over-Month | Year-Over-Year |
|---|---|---|---|
| Albany, NY | 3,577 | -4.6% | -13.9% |
| Allentown, PA | 2,457 | -8.6% | -34.4% |
| Anaheim, CA | 9,961 | -1.8% | -16.4% |
| Atlanta, GA | 33,656 | -7.0% | -9.6% |
| Austin, TX | 9,898 | -1.0% | -14.1% |
| Bakersfield, CA | 2,494 | -2.5% | -14.8% |
| Baltimore, MD | 13,266 | -1.5% | -9.7% |
| Baton Rouge, LA | 3,872 | -5.3% | -22.0% |
| Birmingham, AL | 4,932 | -3.0% | -18.1% |
| Boston, MA | 13,450 | 4.2% | -4.7% |
| Bridgeport, CT | 6,633 | 1.0% | -3.5% |
| Buffalo, NY | 3,036 | -2.1% | -11.7% |
| Camden, NJ | 6,976 | -1.7% | -19.8% |
| Charlotte, NC | 14,240 | -1.5% | -9.0% |
| Chicago, IL | 37,931 | -2.2% | -3.1% |
| Cincinnati, OH | 9,888 | -2.3% | -10.9% |
| Cleveland, OH | 9,750 | -3.6% | -13.0% |
| Columbus, OH | 8,814 | -0.7% | -1.7% |
| Dallas, TX | 24,934 | -0.9% | -3.2% |
| Dayton, OH | 3,521 | -0.5% | -4.2% |
| Denver, CO | 11,824 | -1.2% | -9.3% |
| Detroit, MI | 7,484 | 0.7% | -0.8% |
| El Paso, TX | 3,532 | -2.2% | 3.7% |
| Elgin, IL | 4,271 | -0.3% | 3.7% |
| Fort Lauderdale, FL | 15,716 | -1.4% | -14.1% |
| Fort Worth, TX | 10,865 | 0.2% | -0.4% |
| Frederick, MD | 4,819 | -1.5% | -2.9% |
| Fresno, CA | 2,187 | -3.7% | -19.4% |
| Grand Rapids, MI | 3,834 | -0.2% | -2.0% |
| Greensboro, NC | 2,121 | -7.9% | -33.3% |
| Greenville, SC | 5,201 | -0.2% | 0.1% |
| Hartford, CT | 6,198 | -1.0% | -5.1% |
| Houston, TX | 37,335 | 0.5% | 0.7% |
| Indianapolis, IN | 7,875 | -3.0% | -9.0% |
| Jacksonville, FL | 9,618 | -3.3% | -13.6% |
| Kansas City, MO | 7,326 | -7.8% | -30.4% |
| Knoxville, TN | 4,477 | -2.8% | -7.8% |
| Lake County, IL | 5,586 | -1.0% | -1.9% |
| Las Vegas, NV | 12,562 | -5.1% | -17.8% |
| Los Angeles, CA | 21,160 | -2.8% | -21.1% |
| Louisville, KY | 4,499 | -0.2% | -3.9% |
| McAllen, TX | 2,223 | -0.5% | -9.5% |
| Memphis, TN | 3,797 | -4.0% | -10.1% |
| Miami, FL | 20,450 | -1.4% | -10.6% |
| Milwaukee, WI | 6,378 | -0.2% | -3.5% |
| Minneapolis, MN | 15,750 | 0.7% | 0.4% |
| Montgomery County, PA | 8,139 | 0.6% | -10.3% |
| Nashville, TN | 14,313 | -0.5% | -4.3% |
| Nassau County, NY | 13,869 | 0.3% | -6.0% |
| New Brunswick, NJ | 14,805 | -1.7% | -12.3% |
| New Haven, CT | 4,427 | 1.5% | -6.2% |
| New Orleans, LA | 5,442 | -5.0% | -7.8% |
| New York, NY | 36,942 | 0.6% | -14.6% |
| Newark, NJ | 10,626 | -0.3% | -5.3% |
| North Port, FL | 8,433 | -1.9% | -15.1% |
| Oakland, CA | 5,050 | -1.1% | -21.4% |
| Oklahoma City, OK | 6,811 | -0.8% | -4.5% |
| Omaha, NE | 3,075 | 3.6% | 1.7% |
| Orlando, FL | 12,911 | -2.9% | -16.9% |
| Oxnard, CA | 2,714 | -2.2% | -10.0% |
| Philadelphia, PA | 9,106 | 0.3% | -5.1% |
| Phoenix, AZ | 21,834 | -3.0% | -26.7% |
| Pittsburgh, PA | 10,823 | -0.5% | -2.3% |
| Portland, OR | 9,532 | -0.2% | -10.3% |
| Providence, RI | 7,488 | -1.5% | -7.9% |
| Raleigh, NC | 8,886 | -0.3% | -1.9% |
| Richmond, VA | 4,763 | -1.2% | -7.3% |
| Riverside, CA | 19,231 | -2.4% | -15.6% |
| Rochester, NY | 2,809 | -1.6% | -8.7% |
| Sacramento, CA | 7,546 | 0.9% | -14.5% |
| San Antonio, TX | 11,988 | -4.1% | -5.7% |
| San Diego, CA | 8,744 | -0.9% | -21.1% |
| San Francisco, CA | 2,663 | 2.3% | -1.4% |
| San Jose, CA | 2,993 | -0.1% | -22.9% |
| Seattle, WA | 9,782 | 1.8% | -11.7% |
| St. Louis, MO | 10,999 | -4.1% | -16.7% |
| Tacoma, WA | 2,879 | 1.4% | -19.6% |
| Tampa, FL | 17,152 | -3.2% | -18.6% |
| Tucson, AZ | 5,242 | -2.0% | -14.1% |
| Tulsa, OK | 3,161 | -10.9% | -38.1% |
| Urban Honolulu, HI | 4,087 | -4.2% | -12.9% |
| Virginia Beach, VA | 7,900 | -2.2% | -16.4% |
| Warren, MI | 11,909 | -0.4% | -2.4% |
| Washington, DC | 18,561 | -0.3% | -8.8% |
| West Palm Beach, FL | 15,973 | -1.0% | -12.0% |
| Worcester, MA | 3,483 | -6.4% | -2.1% |
| National | 2,022,600 | -0.8% | -8.3% |
Median Off-Market Redfin Estimate
| Redfin Metro | Estimate | Month-Over-Month | Year-Over-Year |
|---|---|---|---|
| Albany, NY | $194,100 | -0.3% | -9.1% |
| Allentown, PA | $208,800 | 0.2% | 0.3% |
| Atlanta, GA | $228,700 | 0.3% | 4.4% |
| Austin, TX | $295,400 | 0.2% | -1.7% |
| Bakersfield, CA | $189,400 | -0.1% | -11.9% |
| Baltimore, MD | $266,600 | 0.2% | 5.6% |
| Baton Rouge, LA | $127,900 | 0.6% | -15.5% |
| Birmingham, AL | $132,000 | 0.5% | -10.8% |
| Boston, MA | $517,200 | 0.3% | 5.9% |
| Bridgeport, CT | $388,700 | 0.1% | -36.6% |
| Buffalo, NY | $147,500 | 0.1% | -5.3% |
| Camden, NJ | $202,600 | 0.1% | 5.4% |
| Charlotte, NC | $202,800 | 0.6% | -1.5% |
| Chicago, IL | $258,500 | -0.1% | 7.0% |
| Cincinnati, OH | $162,400 | 0.4% | -3.1% |
| Cleveland, OH | $138,100 | 0.0% | 0.1% |
| Columbus, OH | $193,800 | 0.3% | 1.9% |
| Dallas, TX | $256,100 | 0.2% | -0.1% |
| Dayton, OH | $122,200 | 0.3% | 5.0% |
| Denver, CO | $409,200 | 0.2% | -0.2% |
| Detroit, MI | $102,000 | -0.1% | -4.0% |
| Fort Lauderdale, FL | $270,900 | 1.4% | 2.0% |
| Fort Worth, TX | $217,700 | 0.3% | 1.9% |
| Fresno, CA | $256,400 | 0.2% | 1.0% |
| Grand Rapids, MI | $168,000 | 0.7% | 4.9% |
| Greenville, SC | $157,000 | 0.4% | -7.3% |
| Hartford, CT | $221,400 | 0.0% | -34.0% |
| Houston, TX | $197,200 | 0.1% | -5.2% |
| Indianapolis, IN | $161,900 | 0.3% | 1.3% |
| Jacksonville, FL | $209,000 | 0.7% | -4.2% |
| Kansas City, MO | $181,400 | 0.3% | -2.4% |
| Knoxville, TN | $175,100 | 0.4% | 16.1% |
| Las Vegas, NV | $281,800 | 0.4% | 2.9% |
| Los Angeles, CA | $637,800 | 0.4% | 1.6% |
| Louisville, KY | $173,800 | 0.2% | 15.0% |
| Memphis, TN | $143,300 | 0.3% | 5.0% |
| Miami, FL | $310,600 | 0.4% | 4.2% |
| Milwaukee, WI | $194,500 | 0.2% | -6.6% |
| Minneapolis, MN | $269,600 | 0.2% | 4.6% |
| Montgomery County, PA | $320,400 | 0.0% | 1.6% |
| Nashville, TN | $273,300 | 0.7% | 9.8% |
| New Haven, CT | $220,000 | 0.2% | -13.9% |
| New Orleans, LA | $167,500 | 0.2% | -1.2% |
| Newark, NJ | $363,400 | 0.4% | -2.6% |
| Oakland, CA | $762,800 | 0.2% | 0.8% |
| Oklahoma City, OK | $142,600 | 0.1% | 0.5% |
| Omaha, NE | $187,500 | 0.4% | 10.6% |
| Orlando, FL | $231,900 | 0.2% | -0.1% |
| Oxnard, CA | $595,700 | 0.2% | -0.7% |
| Philadelphia, PA | $187,500 | 0.5% | -4.5% |
| Phoenix, AZ | $267,800 | 0.5% | -0.5% |
| Pittsburgh, PA | $130,800 | -0.3% | -9.2% |
| Portland, OR | $394,100 | 0.3% | 0.9% |
| Providence, RI | $289,100 | 0.2% | -1.9% |
| Raleigh, NC | $253,100 | 0.4% | -1.9% |
| Richmond, VA | $232,500 | 0.2% | 4.3% |
| Riverside, CA | $326,400 | 0.4% | -10.4% |
| Rochester, NY | $141,900 | -0.1% | -1.2% |
| Sacramento, CA | $407,900 | 0.3% | 2.0% |
| Salt Lake City, UT | $348,000 | 0.3% | 6.8% |
| San Antonio, TX | $182,300 | 0.1% | -5.4% |
| San Diego, CA | $595,300 | 0.4% | 1.1% |
| San Francisco, CA | $1,346,800 | 0.4% | 1.8% |
| San Jose, CA | $1,117,500 | 0.1% | -7.0% |
| Seattle, WA | $547,400 | 0.5% | -1.4% |
| St. Louis, MO | $155,900 | 0.1% | 0.3% |
| Tacoma, WA | $355,500 | 0.7% | 2.9% |
| Tampa, FL | $217,200 | 0.9% | -0.8% |
| Tucson, AZ | $199,900 | 0.6% | -4.1% |
| Tulsa, OK | $130,300 | 1.8% | -6.0% |
| Warren, MI | $207,000 | -0.5% | -1.6% |
| Washington, DC | $395,400 | 0.0% | 2.2% |
| West Palm Beach, FL | $273,600 | 0.2% | 3.2% |
| Worcester, MA | $275,600 | 0.5% | -2.9% |
| National | $300,900 | 2.8% | 4.3% |


