
Big, old houses lost the least value in the Great Recession
As we near the end of a decade that will be remembered for a strong resurgence in the housing market, some economists (including Robert Shiller, who famously predicted the bursting of the 2000s housing bubble) believe a recession may be around the corner. The changing market and diversity of opinions about what’s ahead are causing people to think carefully about their home-buying and selling prospects. To that end, we did some research to see what homes that best retained their value through the last recession had in common.
Here are five characteristics common among homes that held their value best through the last recession:
- Single-family homes held their value better than townhomes and condos.
- Houses in more spread-out neighborhoods retained their value better than those in areas with denser housing.
- Homes with upwards of five or six bedrooms lost less of their value than those with fewer bedrooms.
- Homes with at least two stories kept their value better than single-story homes.
- Pre-war (those built before 1940) townhouses maintained their value better than newer homes.
To identify features common among homes that best retain their value in a recession, we analyzed the characteristics of over 100,000 homes across over 80 metro areas that sold between July 2007 and September 2008, and sold again between January 2011 and March 2012. We chose these periods because the first coincides with the top of the housing market and the start of the “Great Recession” and the second is when home prices hit bottom and began to climb again.
“During a recession, homebuyers become extra cautious, and for good reasons, like the looming possibility of losing their job or income, and it may be hard to find another buyer if they have to sell unexpectedly soon,” said Redfin chief economist Daryl Fairweather. “In the next recession, it will be the dream homes–think flawless single-family houses in desirable neighborhoods–that still get bought quickly at asking price. Owners of one-bedroom condos and quirky homes should worry more about timing a sale for when the economy is doing well, like it is now.
Single-family homes held their value the best, but townhouses were close behind
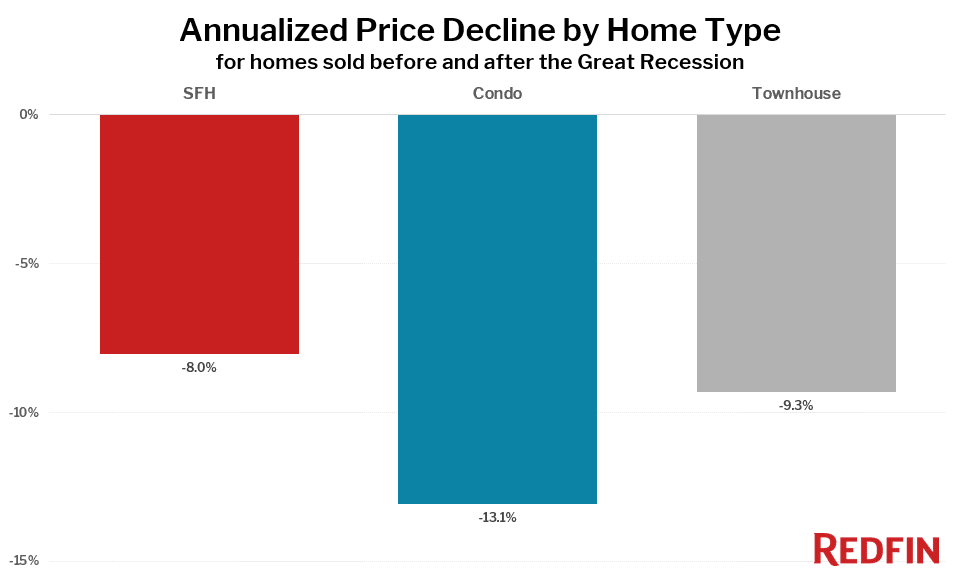
The average home in our analysis lost 9 percent per year during the Great Recession. Single-family homes held their value the best, losing an average of 8 percent of their value each year between the two sales, or about $27,000 in the year after the first sale. Townhomes performed similarly, losing 9.3 percent of their value per year, which amounted to $31,000 in the first year. Condo values dropped the most, falling an average of 13.1 percent per year—a $44,000 decline in the year after the initial sale.
Houses in less dense neighborhoods retained their value better than those in areas with dense housing
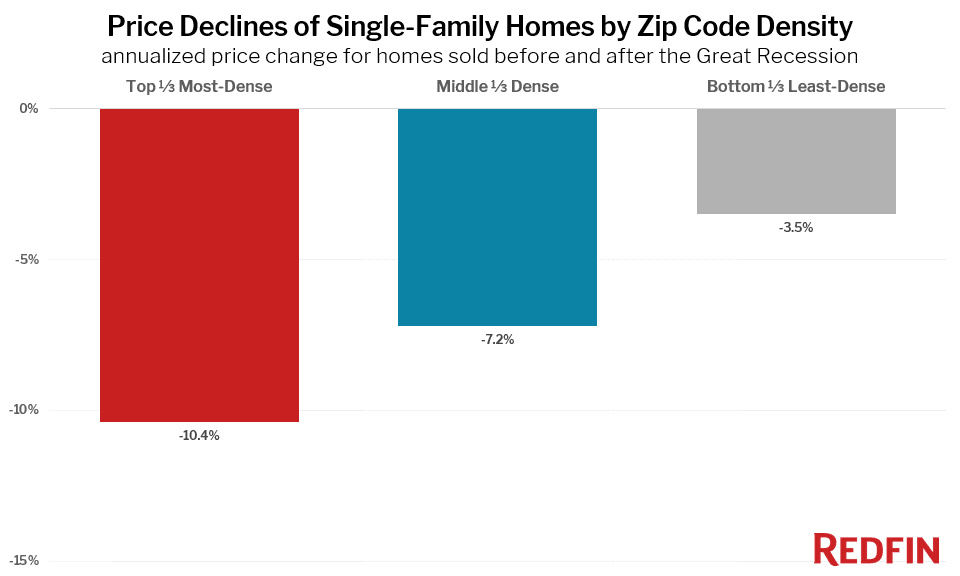
Not only did single-family homes hold their value best, but single-family homes in the neighborhoods where houses are the most spread out held their value even better. Single-family homes located in the least-dense third of zip codes (fewer than 61 homes per square mile) lost an average of only 3.5 percent of their value per year, compared to an average 10.4 percent per year decline for homes in the most dense third of zip codes (828 or more homes per square mile).
The differences for condos and townhomes in zip codes with different densities were negligible, and there were also very few condos and townhomes in the low-density zip codes.
Homes with more bedrooms tend to hold their value better
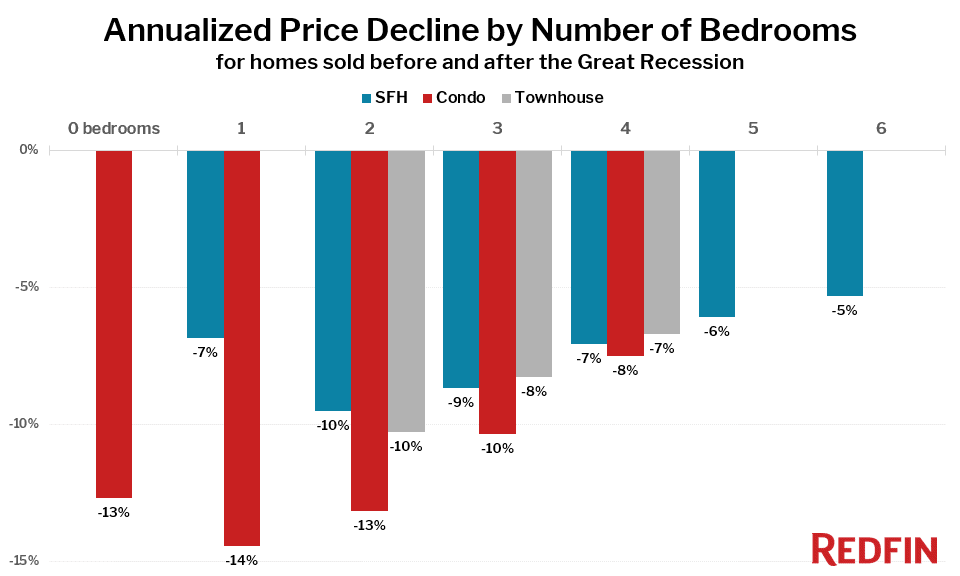
In general, the more bedrooms a home has, the more likely it might be to hold its value in a recession. Homes with four bedrooms only lost 7 to 8 percent of their value per year, while homes with just two bedrooms fell 10 to 13 percent per year between the two sales in 2007-2008 and 2011-2012. However, it’s interesting to note that zero-bedroom (studio) condos performed slightly better than 1-bedroom condos, and one-bedroom houses performed slightly better than two-bedroom houses. It’s possible that this can be explained by the added value that these smaller homes have as rentals.
Homes with at least two stories held their value better
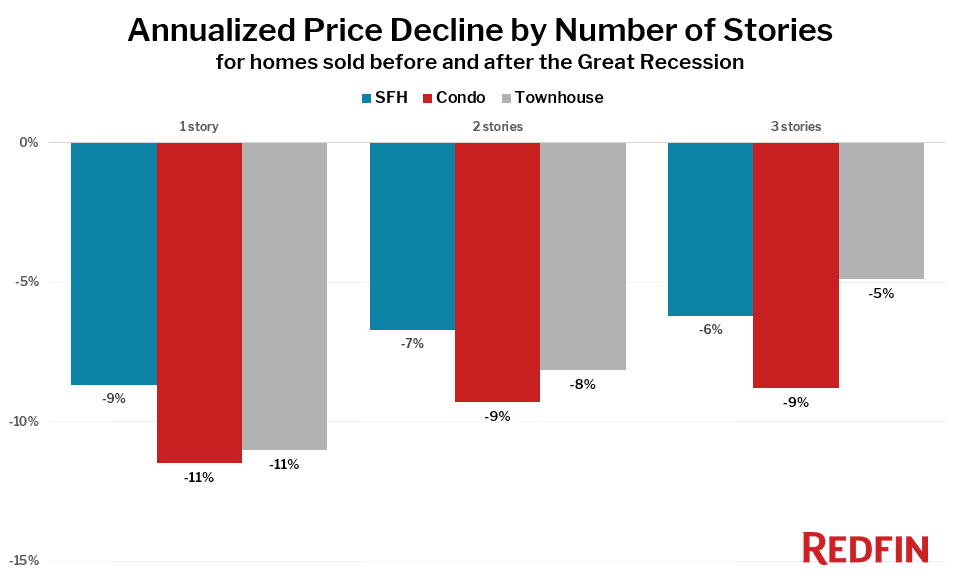
Homes with at least two stories lost less value during the Great Recession than those with just one story. This was true for single-family homes, condos, and townhouses. The difference between two and three stories was fairly minor, except for townhouses, where three-story homes lost just 5 percent of their value per year, versus 8 percent per year for two-story townhouses.
Pre-war townhouses held their value better than newer homes
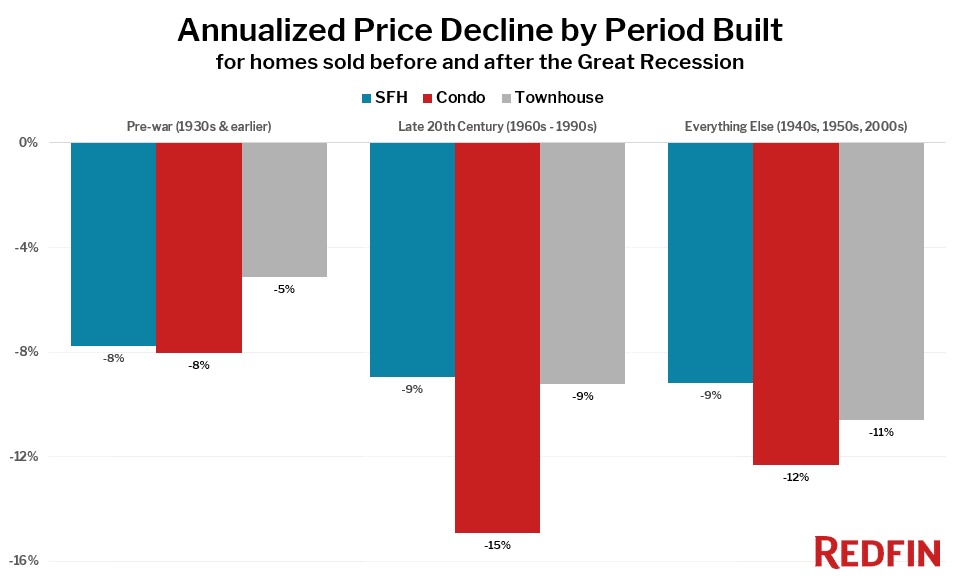
When you break down these repeat housing bust sales by the decade in which the home was built, three major groups become clear: pre-war homes (built in the 1930s and earlier), late 20th century condos (built in the 1960s through 1990s) and everything else.
By far the group that held its value the best were the pre-war Homes, which fell between 3 and 9 percent per year on average. Late 20th century condos fell the furthest, losing 14 to percent per year. The “everything else” category saw values fall between 6 and 13 percent per year.
Methodology
We analyzed 111,000 homes that sold between July 2007 and September 2008, then again between January 2011 and March 2012. For each home the annualized price change was determined and the characteristics of groups of homes were compared against each other. For the density calculations, we calculated the density of every zip code in the data set and grouped the top third most-dense zip codes (828 or more homes per square mile), the middle third, and the bottom third (under 61 homes per square mile).


