Nine of the 10 least hazardous metro areas have median home prices below the $287,400 national median.
When you’re buying a house or moving to a new town, it’s important to consider the potential risks you, your family and your home are likely to face in your new location. In many cases, the hazards you’ll encounter in one part of the country—such as tornadoes in the Midwest—are quite different than the ones locals in another region will barely blink an eye at—think California’s earthquakes. To help quantify some of those risks, we analyzed the frequency of five major types of natural disasters—earthquakes, fires, floods, tornadoes, and hurricanes—in the 50 most populous U.S. metro areas, which we ranked according to a metric we’re calling the “Natural Disaster Hazard Score.”
Each of the five components is measured on a scale of one to 100, where 100 is the most hazardous metro area for the category and one is the least hazardous. The overall Natural Disaster Hazard Score is an average of the five components’ frequencies.
Providence, Rhode Island, with a Natural Disaster Hazard Score of 9 out of 100, is the safest-rated metro area. Providence’s only component score that wasn’t zero was Hurricanes.
Washington, D.C. and Los Angeles are the most natural disaster-prone major metro areas, each with a Natural Disaster Hazard Score of 52. Los Angeles has the highest rates of both earthquakes and fire, while Washington, D.C., ranked highly for hurricanes and floods.
Las Vegas, one of the safest cities from natural disasters, is also one of the most popular migration destinations, with the sixth-highest net inflow of users searching for homes according to Redfin’s Q1 Migration Report.
Below we rank the 50 largest metro areas from least-to-most hazard-prone, according to their Natural Disaster Hazard Score:
| Rank | Metro Area | Natural Disaster Hazard Score | Median Home Sale Price (Feb. 2019) | Earthquakes | Fires | Floods | Tornadoes | Hurricanes |
|---|---|---|---|---|---|---|---|---|
| 1 | Providence, RI | 9 | $255,000 | 0 | 0 | 0 | 0 | 44 |
| 2 | Detroit, MI | 10 | $125,000 | 0 | 0 | 41 | 0 | 7 |
| 3 | Hartford, CT | 11 | $196,000 | 0 | 0 | 12 | 0 | 44 |
| 4 | Las Vegas, NV | 12 | $275,000 | 0 | 41 | 12 | 0 | 7 |
| 5 | Milwaukee, WI | 14 | $190,000 | 0 | 0 | 36 | 26 | 7 |
| 6 | Indianapolis, IN | 14 | $170,000 | 0 | 0 | 18 | 46 | 7 |
| 7 | Buffalo, NY | 15 | $145,000 | 0 | 24 | 22 | 0 | 28 |
| 8 | Salt Lake City, UT | 16 | $320,000 | 0 | 32 | 22 | 26 | 0 |
| 9 | Raleigh, NC | 16 | $286,000 | 0 | 0 | 0 | 26 | 56 |
| 10 | Nashville, TN | 16 | $279,000 | 0 | 0 | 29 | 46 | 7 |
| 11 | Baltimore, MD | 18 | $250,000 | 0 | 0 | 47 | 0 | 44 |
| 12 | Denver, CO | 20 | $400,000 | 0 | 48 | 29 | 26 | 0 |
| 13 | Columbus, OH | 23 | $195,000 | 0 | 0 | 29 | 78 | 7 |
| 14 | Cleveland, OH | 23 | $139,000 | 0 | 0 | 29 | 60 | 28 |
| 15 | Phoenix, AZ | 24 | $267,000 | 0 | 48 | 63 | 0 | 7 |
| 16 | Cincinnati, OH | 24 | $177,000 | 0 | 0 | 68 | 46 | 7 |
| 17 | Boston, MA | 24 | $452,000 | 0 | 24 | 41 | 0 | 56 |
| 18 | San Jose, CA | 25 | $1,040,000 | 58 | 37 | 22 | 0 | 7 |
| 19 | San Diego, CA | 25 | $561,000 | 0 | 70 | 51 | 0 | 7 |
| 20 | Louisville, KY | 26 | $182,000 | 0 | 0 | 75 | 46 | 7 |
| 21 | Charlotte, NC | 27 | $235,000 | 0 | 0 | 22 | 46 | 65 |
| 22 | Orlando, FL | 27 | $249,000 | 0 | 45 | 5 | 26 | 60 |
| 23 | Pittsburgh, PA | 28 | $155,000 | 0 | 0 | 58 | 46 | 35 |
| 24 | Richmond, VA | 28 | $232,000 | 58 | 0 | 18 | 0 | 65 |
| 25 | San Francisco, CA | 30 | $1,280,000 | 58 | 32 | 51 | 0 | 7 |
| 26 | Atlanta, GA | 30 | $235,000 | 0 | 0 | 5 | 100 | 44 |
| 27 | Jacksonville, FL | 30 | $222,000 | 0 | 45 | 5 | 26 | 74 |
| 28 | Tampa, FL | 30 | $225,000 | 0 | 43 | 5 | 26 | 78 |
| 29 | Chicago, IL | 30 | $230,000 | 0 | 0 | 75 | 70 | 7 |
| 30 | Virginia Beach, VA | 30 | $220,000 | 0 | 0 | 12 | 46 | 94 |
| 31 | Miami, FL | 30 | $295,000 | 0 | 32 | 5 | 26 | 90 |
| 32 | Sacramento, CA | 31 | $385,000 | 58 | 51 | 36 | 0 | 7 |
| 33 | Seattle, WA | 33 | $547,000 | 81 | 0 | 83 | 0 | 0 |
| 34 | Memphis, TN | 33 | $166,000 | 0 | 0 | 58 | 78 | 28 |
| 35 | Philadelphia, PA | 33 | $190,000 | 0 | 29 | 68 | 0 | 69 |
| 36 | St. Louis, MO | 33 | $165,000 | 0 | 0 | 100 | 60 | 7 |
| 37 | Birmingham, AL | 34 | $189,000 | 0 | 32 | 29 | 60 | 50 |
| 38 | San Antonio, TX | 34 | $218,000 | 0 | 56 | 41 | 0 | 74 |
| 39 | Kansas City, MO | 35 | $200,000 | 0 | 0 | 75 | 70 | 28 |
| 40 | Oklahoma City, OK | 37 | $174,000 | 0 | 67 | 51 | 60 | 7 |
| 41 | Dallas, TX | 37 | $285,000 | 0 | 63 | 47 | 26 | 50 |
| 42 | Portland, OR | 37 | $390,000 | 81 | 37 | 68 | 0 | 0 |
| 43 | New Orleans, LA | 39 | $210,000 | 0 | 0 | 68 | 26 | 100 |
| 44 | Minneapolis, MN | 40 | $265,000 | 0 | 24 | 91 | 78 | 7 |
| 45 | Houston, TX | 41 | $232,000 | 0 | 51 | 68 | 26 | 60 |
| 46 | Austin, TX | 41 | $296,000 | 0 | 73 | 58 | 26 | 50 |
| 47 | New York, NY | 41 | $380,000 | 0 | 37 | 75 | 26 | 69 |
| 48 | Riverside, CA | 47 | $366,000 | 58 | 96 | 75 | 0 | 7 |
| 49 | Los Angeles, CA | 52 | $600,000 | 100 | 100 | 51 | 0 | 7 |
| 50 | Washington, D.C. | 52 | $380,000 | 58 | 29 | 63 | 26 | 82 |
Nine of the 10 metros with the lowest Natural Disaster Hazard Score ratings have lower home prices than the national median price of $287,400 in February. On the flip side, many of the most disaster-prone metros, including Washington, D.C., Los Angeles and New York are expensive coastal cities that home searchers are increasingly looking to leave.
“When you buy a home you are paying for more than just the house,” said Redfin chief economist Daryl Fairweather. “There could be hidden costs associated with natural disasters. If a natural disaster strikes, you may have to pay for damage to your home or for the cost of evacuating your family. And even during times of calm, you may still need to pay for insurance against floods, fire, or earthquakes. Some homes in more hazardous areas might seem more affordable if you are just looking at the sticker price, but they may end up costing more when risks related to natural disasters are factored in.”
None of the expensive coastal markets have a particularly low Natural Disaster Hazard Score. The high-cost coastal metro area with the lowest score is Boston, with a score of 24—the 17th-lowest score of the 50 biggest metros. San Jose and San Diego—the 18th and 19th-safest metro areas—both have scores of 25.
In addition to high home prices and decreasing affordability in cities like Washington, D.C., Los Angeles and New York, the likelihood of natural disasters may be another factor driving homebuyers away from the coasts. When hurricanes, fires, earthquakes and floods are factored into the equation, the affordable inland metros are even more attractive destinations.
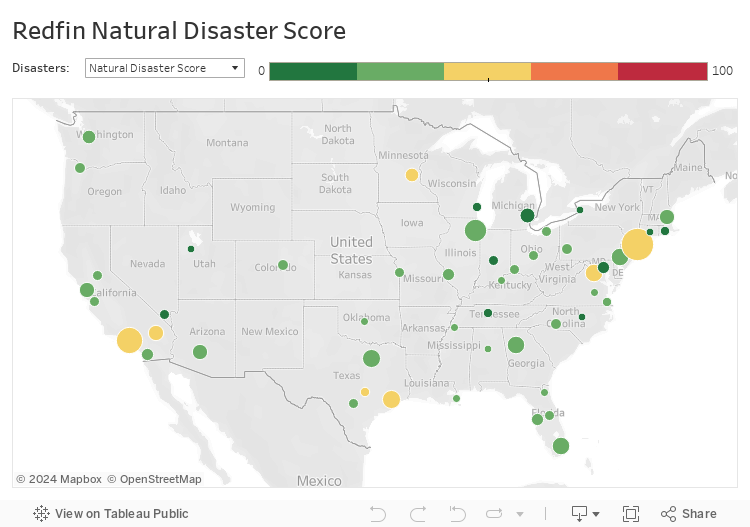
Interactive Map
As you can see in the map below, the metro areas with the highest Natural Disaster Hazard Scores are spread across the country, not centrally located in any one region.
Methodology
The Natural Disasters Hazard Score is made up of five parts: earthquakes, fires, floods, tornadoes, and hurricanes. We used Disaster Declarations Summaries data from FEMA to determine the number of each type of disaster in each metro area between 1953 and the present.
For each of the five components of the Natural Disaster Hazard Score, we scale the rates across the top 50 metro areas such that the metro with the largest rate is scaled to 100. For example, the Atlanta metro area had the highest number of tornadoes (8). That is converted to 100, and Kansas City, which had half as many tornadoes (4) is scaled to 50. We also break the 50 metros down by percentiles, then we average the two numbers to arrive at the individual components of the Natural Disaster Hazard Score. The five components are then averaged together to create the overall Natural Disaster Hazard Score.