To find the best public schools for their children, parents need to do their homework. Fortunately, there are online resources to help them identify which public schools are top of the class, and which aren’t making the grade. The next step is to buy a home in a neighborhood served by those schools. That’s easier said than done.
As Redfin demonstrated last year, being within a highly rated public school zone can have a dramatic effect on the value of your home. When accounting for size, on average, people pay $50 more per square foot for homes in top-rated school zones compared with homes in average-rated zones. But if you’re a new parent, are moving to a new city or are a first-time homebuyer, it can be difficult to determine which neighborhoods have the most highly rated public schools, and what it’s going to take to buy a home there.
Redfin is here to help. We looked at GreatSchools ratings provided by Onboard Informatics in 22 major metropolitan areas to find which neighborhoods have the most highly rated public schools (see full list below). GreatSchools ratings are based on state test scores; as GreatSchools explains, test scores are far from perfect and never tell the whole story, but they are one way for a school to measure the performance of their students on core academic subjects. What’s more, they’re often the only available way to objectively compare to what extent schools are delivering on their promise of teaching certain academic standards.
We also pulled information that will help parents understand what it will take to live in those highly desirable neighborhoods, including data on median sale prices, the percentage of homes that sold above the asking price, how long those homes took to sell, and how many homes hit the market in the past year. We provided the same information for the entire metropolitan area, so parents can compare the neighborhood numbers to the city averages.
When we compared homes in neighborhoods with the most highly rated public schools with homes in the whole metropolitan area, we found that they:
- Are higher priced – $474,900 median sale price vs. $290,000
- Are more likely to sell for over the asking price – 30% sold above list price vs. 23%
- Sell faster – A median of 25 days on the market vs. 31 days
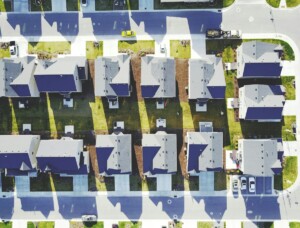
- Are harder to come by – For every 100 homes in a neighborhood, on average only 5.8 hit the market in the past year, compared with 6.5 for the greater metropolitan areas.
So how can a homebuyer get in to these top neighborhoods, where there are likely to be bidding wars? Come prepared. Earlier this year Redfin analyzed data from more than 10,000 offers that Redfin agents wrote in 2013, and determined that the following strategies were the most effective for winning a bidding war:
| Rank | Strategy | Strategy Improves an Offer’s Likelihood of Success by… |
|---|---|---|
| #1 | All-Cash Offer | 28% |
| #2 | Pre-Inspection | 21% |
| #3 | Waived Financing Contingency | 15% |
| #4 | Waived Inspection Contingency | 15% |
| #5 | Personal Cover Letter | 9% |
For more information on these strategies, check out the original report. Before you start your home search, be sure to get in touch with a Redfin agent, who can help you come up with the best strategy for your situation and determine when to throw in the towel or go all-in.
The following is a list of the cities we evaluated for this report and the top three neighborhoods with the most highly rated schools in each. Information on the average school rating, student/teacher ratio and expenditure per student came from GreatSchools. Information on the median sale price of homes and other housing data came from Redfin. We also provided links to more information on Redfin about schools with a GreatSchools rating of 7 or higher in each of the top neighborhoods.
Reminder: these are neighborhoods, not necessarily school zones. To find homes for sale served by any particular school, simply search for the name of the school on Redfin.com
Atlanta, GA Metropolitan Area
| Neighborhood | # of Schools |
Average GreatSchools rating |
Average student/ teacher ratio |
Average spend per student |
Median sale price |
Sold above list price |
Median days on market |
Homes for sale per 100 properties |
|---|---|---|---|---|---|---|---|---|
| #1 Kedron | 3 | 9.8 | 15.9 | $6,306 | $347,000 | 7.4% | 23 | 8 |
| #2 Braelinn | 4 | 9.4 | 13.8 | $6,306 | $220,000 | 7.6% | 19 | 6 |
| #3 Buckhead | 9 | 7.1 | 14.4 | $6,641 | $377,250 | 11.9% | 37 | 14 |
| Atlanta, GA | 1,100 | 5.6 | 14.6 | $5,500 | $165,000 | 19.0% | 36 | 10 |
Highly-ranked schools in Kedron (Peachtree City, GA)
Highly-ranked schools in Braelinn (Peachtree City, GA)
- Booth Middle School
- Braelinn Elementary School
- Huddleston Elementary School
- Oak Grove Elementary School
Highly-ranked schools in Buckhead (Atlanta, GA)
Austin, TX Metropolitan Area

| Neighborhood | # of Schools |
Average GreatSchools rating |
Average student/ teacher ratio |
Average spend per student |
Median sale price |
Sold above list price |
Median days on market |
Homes for sale per 100 properties |
|---|---|---|---|---|---|---|---|---|
| #1 Steiner Ranch | 4 | 10.0 | 15.7 | $4,459 | $430,000 | 12.2% | 26 | 10 |
| #2 Circle C Ranch | 4 | 10.0 | 14.7 | $5,106 | $389,000 | 32.9% | 7 | 7 |
| #3 East Oak Hill | 3 | 8.6 | 15.1 | $5,106 | $417,000 | 31.1% | 7 | 5 |
| Austin, TX | 400 | 6.2 | 13.9 | $4,600 | $235,000 | 25.1% | 18 | 7 |
Highly-ranked schools in Steiner Ranch (Austin, TX)
- Canyon Ridge Middle School
- Laura Welch Bush Elementary School
- River Ridge Elementary School
- Steiner Ranch Elementary School
Highly-ranked schools in Circle C Ranch (Austin, TX)
Highly-ranked schools in East Oak Hill (Austin, TX)
- Oak Hill Elementary School
- Patton Elementary School
- Small Middle School
- Valley View Elementary School
Boston, MA Metropolitan Area
| Neighborhood | # of Schools |
Average GreatSchools rating |
Average student/ teacher ratio |
Average spend per student |
Median sale price |
Sold above list price |
Median days on market |
Homes for sale per 100 properties |
|---|---|---|---|---|---|---|---|---|
| #1 Fenway / Kenmore Square | 3 | 7.9 | 20.1 | $10,126 | $494,000 | 32.9% | 15.5 | 5 |
| #2 Braintree Highlands | 3 | 7.6 | 14.5 | $7,477 | $294,000 | 15.9% | 45 | 4 |
| Boston, MA | 1,400 | 5.2 | 13.5 | $7,600 | $344,900 | 24.5% | 43 | 6 |
Highly-ranked schools in Fenway/Kenmore Square (Boston, MA)
Highly-ranked schools in Braintree Highlands (Braintree, MA)
Chicago, IL Metropolitan Area
| Neighborhood | # of Schools |
Average GreatSchools rating |
Average student/ teacher ratio |
Average spend per student |
Median sale price |
Sold above list price |
Median days on market |
Homes for sale per 100 properties |
|---|---|---|---|---|---|---|---|---|
| #1 Downtown Northbrook | 3 | 10.0 | 10.7 | $10,287 | $395,000 | 18.0% | 15 | 6 |
| #2 Downtown La Grange | 3 | 9.9 | 14.9 | $7,646 | $359,500 | 13.8% | 21.5 | 5 |
| #3 North Center / Roscoe Village | 4 | 9.8 | 17.5 | $6,463 | $446,000 | 22.1% | 11 | 6 |
| Chicago, IL | 2,300 | 5.1 | 16.4 | $5,900 | $190,000 | 17.3% | 28 | 6 |
Highly-ranked schools in Downtown Northbrook (Northbrook, IL)
Highly-ranked schools in Downtown La Grange (La Grange, IL)
Highly-ranked schools in North Center / Roscoe Village (Chicago, IL)
- Audubon Elementary School
- Bell Elementary School
- Coonley Elementary School
- Lane Technical High School
Denver, CO Metropolitan Area
| Neighborhood | # of Schools |
Average GreatSchools rating |
Average student/ teacher ratio |
Average spend per student |
Median sale price |
Sold above list price |
Median days on market |
Homes for sale per 100 properties |
|---|---|---|---|---|---|---|---|---|
| #1 South Park Hill | 3 | 8.9 | 23.2 | $4,785 | $430,000 | 27.9% | 17 | 7 |
| #2 Stapleton | 3 | 8.7 | 17.4 | $4,785 | $347,750 | 20.2% | 15 | 8 |
| #3 Hilltop | 4 | 7.0 | 16.6 | $4,785 | $564,950 | 19.5% | 20 | 8 |
| Denver, CO | 700 | 5.2 | 17.8 | $4,600 | $265,000 | 26.2% | 15 | 8 |
Highly-ranked schools in South Park Hill (Denver, CO)
Highly-ranked schools in Stapleton (Denver, CO)
- Denver School of Science And Technology: Stapleton High School
- Westerly Creek Elementary School
- William (Bill) Roberts K-8 School
Highly-ranked schools in Hilltop (Denver, CO)
Houston, TX Metropolitan Area
| Neighborhood | # of Schools |
Average GreatSchools rating |
Average student/ teacher ratio |
Average spend per student |
Median sale price |
Sold above list price |
Median days on market |
Homes for sale per 100 properties |
|---|---|---|---|---|---|---|---|---|
| #1 Shadow Creek Ranch | 3 | 9.1 | 16.5 | $4,349 | $253,021 | 14.4% | 39 | 12 |
| #2 Kingwood | 14 | 8.9 | 14.9 | $4,811 | $205,000 | 17.1% | 18 | 7 |
| #3 Sugar Creek | 3 | 8.4 | 16.8 | $4,805 | $267,500 | 12.5% | 22 | 5 |
| Houston, TX | 1,500 | 5.8 | 15.1 | $4,500 | $194,500 | 20.4% | 24 | 6 |
Highly-ranked schools in Shadow Creek Ranch (Pearland, TX)
Highly-ranked schools in Kingwood (Kingwood, TX)
- Bear Branch Elementary School
- Creekwood Middle School
- Deerwood Elementary School
- Elm Grove Elementary School
- Foster Elementary School
- Greentree Elementary School
- Hidden Hollow Elementary School
- Kingwood High School
- Kingwood Middle School
- Kingwood Park High School
- Riverwood Middle School
- Shadow Forest Elementary School
- Willow Creek Elementary School
- Woodland Hills Elementary School
Highly-ranked schools in Sugar Creek (Sugar Land, TX)
Las Vegas, NV Metropolitan Area
| Neighborhood | # of Schools |
Average GreatSchools rating |
Average student/ teacher ratio |
Average spend per student |
Median sale price |
Sold above list price |
Median days on market |
Homes for sale per 100 properties |
|---|---|---|---|---|---|---|---|---|
| #1 Green Valley Ranch | 3 | 10.0 | 24.0 | $4,825 | $270,000 | 30.3% | 53 | 7 |
| #2 Summerlin North | 7 | 8.7 | 21.0 | $4,825 | $255,000 | 18.9% | 65 | 9 |
| #3 Westgate | 4 | 8.3 | 24.1 | $4,825 | $265,000 | 22.0% | 66 | 8 |
| Las Vegas, NV | 300 | 5.1 | 20.1 | $4,600 | $175,000 | 27.4% | 67 | 8 |
Highly-ranked schools in Green Valley Ranch (Henderson, NV)
Highly-ranked schools in Summerlin North (Las Vegas, NV)
- Ernest Becker Middle School
- Ethel W. Staton Elementary School
- John W Bonner Elementary School
- Linda Rankin Givens Elementary School
- Palo Verde High School
- Richard H Bryan Elementary School
- William Lummis Elementary School
Highly-ranked schools in Westgate (Henderson, NV)
Long Island, NY Metropolitan Area
| Neighborhood | # of Schools |
Average GreatSchools rating |
Average student/ teacher ratio |
Average spend per student |
Median sale price |
Sold above list price |
Median days on market |
Homes for sale per 100 properties |
|---|---|---|---|---|---|---|---|---|
| #1 South Wantagh | 5 | 9.3 | 12.9 | $12,075 | $425,000 | 12.0% | 49 | 3 |
| #2 North Syosset | 3 | 8.6 | 10.0 | $15,893 | $870,000 | 9.2% | 64 | 7 |
| #3 North Baldwin | 3 | 8.4 | 12.6 | $12,527 | $315,000 | 9.2% | 64.5 | 5 |
| Long Island, NY | 600 | 6.2 | 12.7 | $12,100 | $365,000 | 9.1% | 71 | 5 |
Highly-ranked schools in South Wantagh (Wantagh, NY)
- Forest Lake School
- Mandalay School
- Seaford Senior High School
- Wantagh Middle School
- Wantagh School
- Wantagh Senior High School
Highly-ranked schools in North Syosset (Syosset, NY)
Highly-ranked schools in North Baldwin (North Baldwin, NY)
Los Angeles, CA Metropolitan Area
| Neighborhood | # of Schools |
Average GreatSchools rating |
Average student/ teacher ratio |
Average spend per student |
Median sale price |
Sold above list price |
Median days on market |
Homes for sale per 100 properties |
|---|---|---|---|---|---|---|---|---|
| #1 Crescenta Highlands | 3 | 9.6 | 20.0 | $5,870 | $619,000 | 51.5% | 15 | 4 |
| #2 Lunada Bay | 3 | 9.3 | 23.9 | $5,811 | $1,490,000 | 29.7% | 25 | 5 |
| #3 Pacific Palisades | 3 | 9.3 | 23.6 | $4,394 | $2,080,375 | 33.6% | 21 | 5 |
| Los Angeles, CA | 2,100 | 4.9 | 20.8 | $3,500 | $458,000 | 36.8% | 20 | 5 |
Highly-ranked schools in Crescenta Highlands (Glendale, CA)
- Abraham Lincoln Elementary School
- Anderson W. Clark Magnet High School
- Dunsmore Elementary School
- Valley View Elementary School
Highly-ranked schools in Lunada Bay (Palos Verdes Estates, CA)
Highly-ranked schools in Pacific Palisades (Pacific Palisades, CA)
- Canyon Elementary School
- Marquez Avenue Elementary School
- Palisades Charter Elementary School
- Palisades Charter High School
- Paul Revere Middle School
Miami/Fort Lauderdale, FL Metropolitan Area
| Neighborhood | # of Schools |
Average GreatSchools rating |
Average student/ teacher ratio |
Average spend per student |
Median sale price |
Sold above list price |
Median days on market |
Homes for sale per 100 properties |
|---|---|---|---|---|---|---|---|---|
| #1 Chapel Trail | 5 | 8.4 | 22.1 | $5,293 | $305,000 | 24.9% | 25 | 6 |
| #2 Highland Lakes | 3 | 7.7 | 17.9 | $5,372 | $392,500 | 18.4% | 49 | 9 |
| #2 Pembroke Falls | 3 | 7.4 | 20.3 | $5,293 | $395,000 | 22.6% | 47 | 7 |
| Miami/Fort Lauderdale, FL | 750 | 5.1 | 16.1 | $4,700 | $191,000 | 18.7% | 43 | 8 |
Highly-ranked schools in Chapel Trail (Pembroke Pines, FL)
- Chapel Trail Elementary School
- Silver Trail Middle School
- Somerset Academy
- Somerset Academy Charter High
- Somerset Academy Middle School
- West Broward High School
Highly-ranked schools in Highland Lakes (Miami, FL)
Highly-ranked schools in Pembroke Falls (Pembroke Pines, FL)
Orange County, CA Metropolitan Area
| Neighborhood | # of Schools |
Average GreatSchools rating |
Average student/ teacher ratio |
Average spend per student |
Median sale price |
Sold above list price |
Median days on market |
Homes for sale per 100 properties |
|---|---|---|---|---|---|---|---|---|
| #1 Turtle Rock | 3 | 10.0 | 26.3 | $5,143 | $1,150,000 | 13.0% | 23 | 5 |
| #2 El Camino Real | 4 | 9.9 | 24.5 | $5,143 | $600,500 | 31.9% | 20.5 | 4 |
| #3 Northwood | 4 | 9.8 | 20.8 | $5,143 | $724,084 | 24.0% | 24 | 5 |
| Orange County, CA | 600 | 6.4 | 22.5 | $4,900 | $547,995 | 20.7% | 24 | 5 |
Highly-ranked schools in Turtle Rock (Irvine, CA)
Highly-ranked schools in El Camino Real (Irvine, CA)
Highly-ranked schools in Northwood (Irvine, CA)
- Brywood Elementary School
- Northwood Elementary School
- Santiago Hills Elementary School
- Sierra Vista Middle School
Philadelphia, PA Metropolitan Area
| Neighborhood | # of Schools |
Average GreatSchools rating |
Average student/ teacher ratio |
Average spend per student |
Median sale price |
Sold above list price |
Median days on market |
Homes for sale per 100 properties |
|---|---|---|---|---|---|---|---|---|
| #1 Wayne | 4 | 9.6 | 12.9 | $9,331 | $519,500 | 14.1% | 51.5 | 6 |
| #2 Bala Cynwyd | 3 | 9.5 | 11.1 | $11,608 | $450,000 | 8.9% | 57 | 6 |
| #3 Havertown | 5 | 8.5 | 14.9 | $6,827 | $263,750 | 8.4% | 62 | 5 |
| Philadelphia, PA | 800 | 4.8 | 14.4 | $16,600 | $230,000 | 10.9% | 62 | 5 |
Highly-ranked schools in Wayne (Wayne, PA)
- New Eagle Elementary School
- Radnor Elementary School
- Radnor Middle School
- Radnor Senior High School
- Roberts Elementary School
- Valley Forge Elementary School
- Valley Forge Middle School
- Wayne Elementary School
Highly-ranked schools in Bala Cynwyd (Bala Cynwyd, PA)
Highly-ranked schools in Havertown (Havertown, PA)
- Chatham Park Elementary School
- Haverford Middle School
- Haverford Senior High School
- Lynnewood Elementary School
- Manoa Elementary School
Phoenix, AZ Metropolitan Area
| Neighborhood | # of Schools |
Average GreatSchools rating |
Average student/ teacher ratio |
Average spend per student |
Median sale price |
Sold above list price |
Median days on market |
Homes for sale per 100 properties |
|---|---|---|---|---|---|---|---|---|
| #1 Desert Ridge | 4 | 10.0 | 23.8 | $4,313 | $388,500 | 6.7% | 35 | 7 |
| #2 Hillcrest Ranch | 3 | 8.8 | 23.0 | $4,339 | $262,000 | 12.9% | 13 | 9 |
| #3 Ahwatukee | 17 | 8.7 | 19.8 | $3,947 | $265,000 | 10.3% | 31 | 7 |
| Phoenix, AZ | 1,200 | 5.9 | 18.0 | $4,500 | $191,130 | 13.2% | 33 | 8 |
Highly-ranked schools in Desert Ridge (Phoenix, AZ)
- Desert Trails Elementary School
- Explorer Middle School
- Pinnacle High School
- Wildfire Elementary School
Highly-ranked schools in Hillcrest Ranch (Glendale, AZ)
Highly-ranked schools in Ahwatukee (Phoenix, AZ)
- Desert Vista High School
- Horizon Community Learning Center
- Keystone Montessori Charter School
- Kyrene Akimel A-Al Middle School
- Kyrene Altadena Middle School
- Kyrene de la Colina School
- Kyrene de la Esperanza School
- Kyrene de la Estrella Elementary School
- Kyrene de la Sierra School
- Kyrene de Los Cerritos School
- Kyrene de Los Lagos School
- Kyrene Del Milenio
- Kyrene Monte Vista
- Mountain Pointe High School
Portland, OR Metropolitan Area
| Neighborhood | # of Schools |
Average GreatSchools rating |
Average student/ teacher ratio |
Average spend per student |
Median sale price |
Sold above list price |
Median days on market |
Homes for sale per 100 properties |
|---|---|---|---|---|---|---|---|---|
| #1 Bolton | 3 | 9.8 | 23.8 | $4,916 | $269,500 | 22.9% | 31 | 7 |
| #2 Northwest | 4 | 9.7 | 21.1 | $6,247 | $445,000 | 18.0% | 23 | 5 |
| #3 Belmont | 3 | 8.7 | 20.7 | $6,247 | $410,000 | 30.9% | 11 | 4 |
| Portland, OR | 600 | 5.5 | 19.5 | $5,000 | $270,000 | 26.9% | 25 | 7 |
Highly-ranked schools in Bolton (West Linn, OR)
Highly-ranked schools in Northwest (Portland, OR)
- Ainsworth Elementary School
- Chapman Elementary School
- Lincoln High School
- Metropolitan Learning Center
Highly-ranked schools in Belmont (Portland, OR)
Riverside-San Bernardino, CA Metropolitan Area
| Neighborhood | # of Schools |
Average GreatSchools rating |
Average student/ teacher ratio |
Average spend per student |
Median sale price |
Sold above list price |
Median days on market |
Homes for sale per 100 properties |
|---|---|---|---|---|---|---|---|---|
| #1 Etiwanda | 4 | 8.1 | 24.1 | $4,855 | $540,000 | 31.3% | 22 | 7 |
| #2 Heritage / West End | 3 | 8.0 | 20.3 | $4,388 | $355,000 | 50.3% | 13 | 6 |
| #3 Corona Valley | 6 | 7.7 | 23.0 | $4,918 | $470,000 | 32.6% | 24 | 5 |
| Riverside-San Bernardino, CA | 1,000 | 5.1 | 22.3 | $5,000 | $270,000 | 29.7% | 27 | 6 |
Highly-ranked schools in Etiwanda (Rancho Cucamonga, CA)
- Etiwanda Colony Elementary School
- Etiwanda High School
- Etiwanda Intermediate School
- Summit Intermediate School
Highly-ranked schools in Heritage / West End (Fontana, CA)
Highly-ranked schools in Corona Valley (Corona, CA)
- Clara Barton Elementary School
- Eastvale Elementary School
- Eleanor Roosevelt High School
- Harada Elementary School
- Highland Elementary School
- Rosa Parks Elementary School
Sacramento, CA Metropolitan Area
| Neighborhood | # of Schools |
Average GreatSchools rating |
Average student/ teacher ratio |
Average spend per student |
Median sale price |
Sold above list price |
Median days on market |
Homes for sale per 100 properties |
|---|---|---|---|---|---|---|---|---|
| #1 Old Town Rocklin | 3 | 9.1 | 15.2 | $4,568 | $317,450 | 35.6% | 20.5 | 6 |
| #2 Highland Reserve | 3 | 8.5 | 25.0 | $4,473 | $360,000 | 28.5% | 13 | 9 |
| #3 Central Davis | 5 | 8.3 | 22.9 | $5,410 | $575,000 | 38.5% | 11 | 3 |
| Sacramento, CA | 600 | 5.6 | 20.0 | $4,600 | $285,000 | 29.7% | 22 | 7 |
Highly-ranked schools in Old Town Rocklin (Rocklin, CA)
Highly-ranked schools in Highland Reserve (Roseville, CA)
Highly-ranked schools in Central Davis (Davis, CA)
- Cesar Chavez Elementary School
- Davis Senior High School
- North Davis Elementary School
- Robert E. Willett Elementary School
San Diego, CA Metropolitan Area
| Neighborhood | # of Schools |
Average GreatSchools rating |
Average student/ teacher ratio |
Average spend per student |
Median sale price |
Sold above list price |
Median days on market |
Homes for sale per 100 properties |
|---|---|---|---|---|---|---|---|---|
| #1 Torrey Hills | 8 | 9.6 | 20.9 | $6,144 | $640,000 | 18.3% | 20 | 6 |
| #2 La Jolla | 3 | 9.5 | 23.7 | $5,777 | $1,250,000 | 10.5% | 34 | 7 |
| #3 Loma Portal | 3 | 9.3 | 20.4 | $5,777 | $425,000 | 12.5% | 21 | 6 |
| San Diego, CA | 700 | 5.6 | 20.3 | $5,400 | $428,900 | 21.6% | 21 | 7 |
Highly-ranked schools in Torrey Hills (San Diego, CA)
- Ashley Falls Elementary School
- Carmel Creek Elementary School
- Carmel Del Mar Elementary School
- Carmel Valley Middle School
- Solana Highlands Elementary School
- Solana Pacific Elementary School
- Sycamore Ridge School
- Torrey Pines High School
Highly-ranked schools in La Jolla (La Jolla, CA)
- Bird Rock Elementary School
- La Jolla Elementary School
- La Jolla High School
- Muirlands Middle School
- Torrey Pines Elementary School
Highly-ranked schools in Loma Portal (San Diego, CA)
San Francisco, CA Metropolitan Area
| Neighborhood | # of Schools |
Average GreatSchools rating |
Average student/ teacher ratio |
Average spend per student |
Median sale price |
Sold above list price |
Median days on market |
Homes for sale per 100 properties |
|---|---|---|---|---|---|---|---|---|
| #1 Outer Parkside | 3 | 8.7 | 17.7 | $4,889 | $780,000 | 85.7% | 15 | 2 |
| #2 Sunset District | 13 | 8.2 | 19.6 | $4,889 | $908,000 | 83.6% | 14 | 2 |
| #3 Inner Richmond | 3 | 7.9 | 19.3 | $4,889 | $1,287,500 | 72.7% | 14.5 | 2 |
| San Francisco, CA | 300 | 5.4 | 17.5 | $4,500 | $850,000 | 63.1% | 14 | 4 |
Highly-ranked schools in Outer Parkside (San Francisco, CA)
Highly-ranked schools in Sunset District (San Francisco, CA)
- Dianne Feinstein Elementary School
- Hoover (Herbert) Middle School
- Jefferson Elementary School
- Key (Francis Scott) Elementary School
- Lawton Alternative Elementary School
- Lincoln (Abraham) High School
- Stevenson (Robert Louis) Elementary School
- West Portal Elementary School
- Yu (Alice Fong) Elementary School
Highly-ranked schools in Inner Richmond (San Francisco, CA)
San Jose, CA Metropolitan Area
| Neighborhood | # of Schools |
Average GreatSchools rating |
Average student/ teacher ratio |
Average spend per student |
Median sale price |
Sold above list price |
Median days on market |
Homes for sale per 100 properties |
|---|---|---|---|---|---|---|---|---|
| #1 Monta Vista | 3 | 10.0 | 21.9 | $5,514 | $1,703,000 | 75.3% | 10 | 3 |
| #2 Blossom Hill | 3 | 9.5 | 22.1 | $5,477 | $794,000 | 65.6% | 11 | 5 |
| #3 North Los Altos | 5 | 9.4 | 17.3 | $8,330 | $2,160,000 | 72.3% | 9 | 4 |
| San Jose, CA | 400 | 5.9 | 20.1 | $5,200 | $703,000 | 60.9% | 12 | 4 |
Highly-ranked schools in Monta Vista (Cupertino, CA)
Highly-ranked schools in Blossom Hill (Los Gatos, CA)
- Alta Vista Elementary School
- Blossom Hill Elementary School
- Dartmouth Middle School
- Noddin Elementary School
- Pioneer High School
- Raymond J. Fisher Middle School
- Union Middle School
Highly-ranked schools in North Los Altos (Los Altos, CA)
- Almond Elementary School
- Ardis G. Egan Junior High School
- Bullis Charter School
- Los Altos High School
- Santa Rita Elementary School
Seattle, WA Metropolitan Area
| Neighborhood | # of Schools |
Average GreatSchools rating |
Average student/ teacher ratio |
Average spend per student |
Median sale price |
Sold above list price |
Median days on market |
Homes for sale per 100 properties |
|---|---|---|---|---|---|---|---|---|
| #1 Queen Anne | 4 | 9.1 | 18.3 | $6,653 | $499,375 | 27.4% | 13 | 6 |
| #2 Ballard | 6 | 8.9 | 20.0 | $6,653 | $480,000 | 47.6% | 7 | 6 |
| #3 Factoria | 3 | 8.6 | 21.5 | $5,768 | $265,000 | 44.9% | 8 | 6 |
| Seattle, WA | 600 | 5.9 | 18.7 | $5,200 | $359,450 | 31.9% | 16 | 6 |
Highly-ranked schools in Queen Anne (Seattle, WA)
Highly-ranked schools in Ballard (Seattle, WA)
- Adams Elementary School
- Ballard High School
- Loyal Heights Elementary School
- Salmon Bay School
- West Woodland Elementary School
- Whittier Elementary School
Highly-ranked schools in Factoria (Bellevue, WA)
Tacoma, WA Metropolitan Area
| Neighborhood | # of Schools |
Average GreatSchools rating |
Average student/ teacher ratio |
Average spend per student |
Median sale price |
Sold above list price |
Median days on market |
Homes for sale per 100 properties |
|---|---|---|---|---|---|---|---|---|
| #1 University Place | 7 | 7.4 | 19.2 | $5,888 | $275,000 | 17.2% | 31 | 5 |
| #2 Northeast Tacoma | 4 | 6.8 | 19.2 | $5,965 | $285,250 | 25.0% | 35.5 | 7 |
| #3 Oakbrook | 4 | 6.2 | 18.5 | $6,358 | $221,000 | 16.5% | 41 | 5 |
| Tacoma, WA | 200 | 5.2 | 18.9 | $5,200 | $225,000 | 25.0% | 37 | 7 |
Highly-ranked schools in University Place (University Place, WA)
- Chambers Primary School
- Curtis Junior High School
- Drum Intermediate School
- Evergreen Primary School
- Narrows View Intermediate School
- Sunset Primary School
Highly-ranked schools in Northeast Tacoma (Tacoma, WA)
Highly-ranked schools in Oakbrook (Lakewood, WA)
Ventura County, CA Metropolitan Area
| Neighborhood | # of Schools |
Average GreatSchools rating |
Average student/ teacher ratio |
Average spend per student |
Median sale price |
Sold above list price |
Median days on market |
Homes for sale per 100 properties |
|---|---|---|---|---|---|---|---|---|
| #1 Westlake Village | 3 | 9.8 | 21.4 | $5,646 | $730,000 | 15.9% | 22.5 | 6 |
| #2 Newbury Park | 3 | 9.3 | 24.1 | $5,457 | $630,000 | 19.8% | 21 | 4 |
| #3 Mission Oaks | 3 | 8.7 | 23.6 | $5,916 | $530,000 | 25.5% | 18 | 4 |
| Ventura County, CA | 200 | 5.3 | 22.1 | $5,200 | $475,000 | 23.7% | 22 | 5 |
Highly-ranked schools in Westlake Village (Westlake Village, CA)
Highly-ranked schools in Newbury Park (Newbury Park/Thousand Oaks, CA)
- Banyan Elementary School
- Cypress Elementary School
- Madrona Elementary School
- Maple Elementary School
- Newbury Park High School
- Sequoia Middle School
- Sycamore Canyon School
- Walnut Elementary School
Highly-ranked schools in Mission Oaks (Camarillo, CA)
For more information about buying a home in any of these neighborhoods, get in touch with a Redfin real estate agent today. To start your home search, visit Redfin.com.

Methodology
For this study, we looked at GreatSchools ratings provided by Onboard Informatics in 22 major metropolitan areas across the country – that means the major city and all of it’s surrounding areas. We only looked at public schools and public charters. To be included, a neighborhood had to have at least three public schools with a rating that was higher than the metro average. Top neighborhoods were chosen based on overall average school quality. The public schools that we linked to for each neighborhood have a GreatSchools rating of 7 or higher. Disclaimer: while we’ve done our best to accurately report this information based on the data we have available, we can’t guarantee schools zones, ratings or placements within a certain neighborhood.