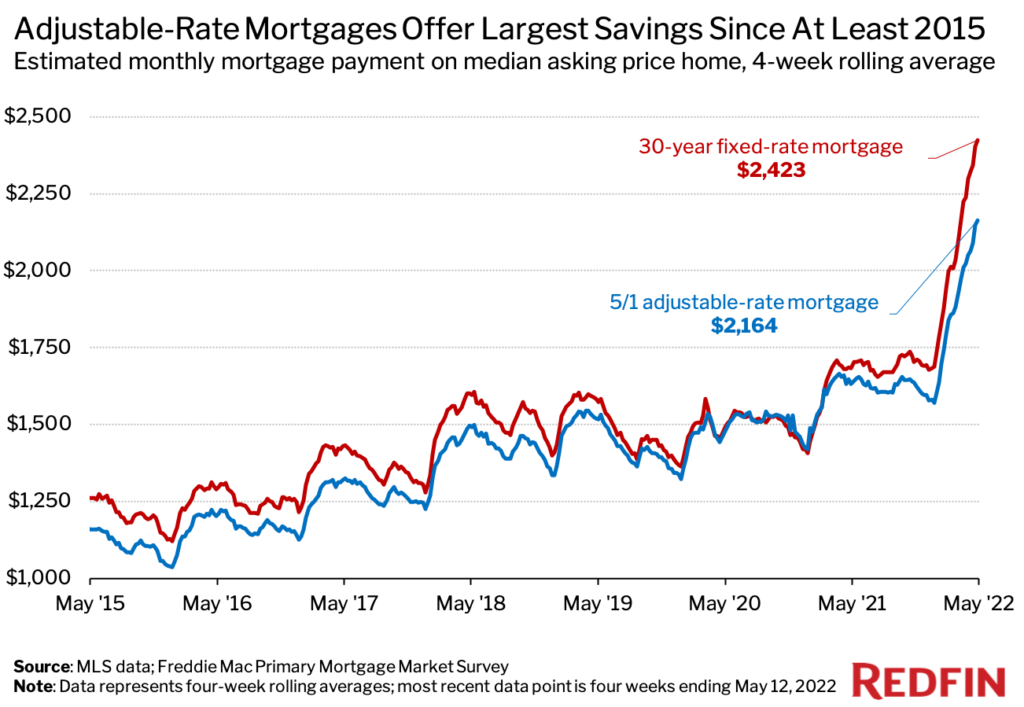
That’s $260 per month for the typical homebuyer—the largest savings since at least 2015. As mortgage rates surge, demand for adjustable-rate mortgages is on the rise because they typically have lower interest rates than 30-year fixed loans.
The typical homebuyer could save an estimated $15,582 over five years, or roughly $260 per month, by taking out an adjustable-rate mortgage rather than a 30-year-fixed-rate mortgage. That’s the largest savings in dollar terms for adjustable-rate mortgage holders since at least 2015.
This is according to a Redfin analysis of estimated monthly mortgage payments on the median-asking-price home during the four weeks ending May 12 for 30-year fixed mortgages and 5/1 adjustable-rate mortgages (ARM). A 5/1 ARM is a loan in which the interest rate is fixed for the first five years and then adjusts once a year for the remainder of the loan term, which is typically 30 years. Borrowers can also choose ARMs in which the interest rate resets after seven years, 10 years and other durations, but this report focuses on 5/1 ARMs—one of the most popular types. By comparison, 30-year fixed mortgages allow borrowers to keep their rate for the full duration of the loan. Scroll down to see the full methodology for this analysis.
The typical monthly payment for buyers who took out a 5/1 ARM was an estimated $2,164 during the four weeks ending May 12. That’s roughly 11% ($260) lower than the $2,423 estimated typical payment for buyers who took out a 30-year fixed-rate mortgage.
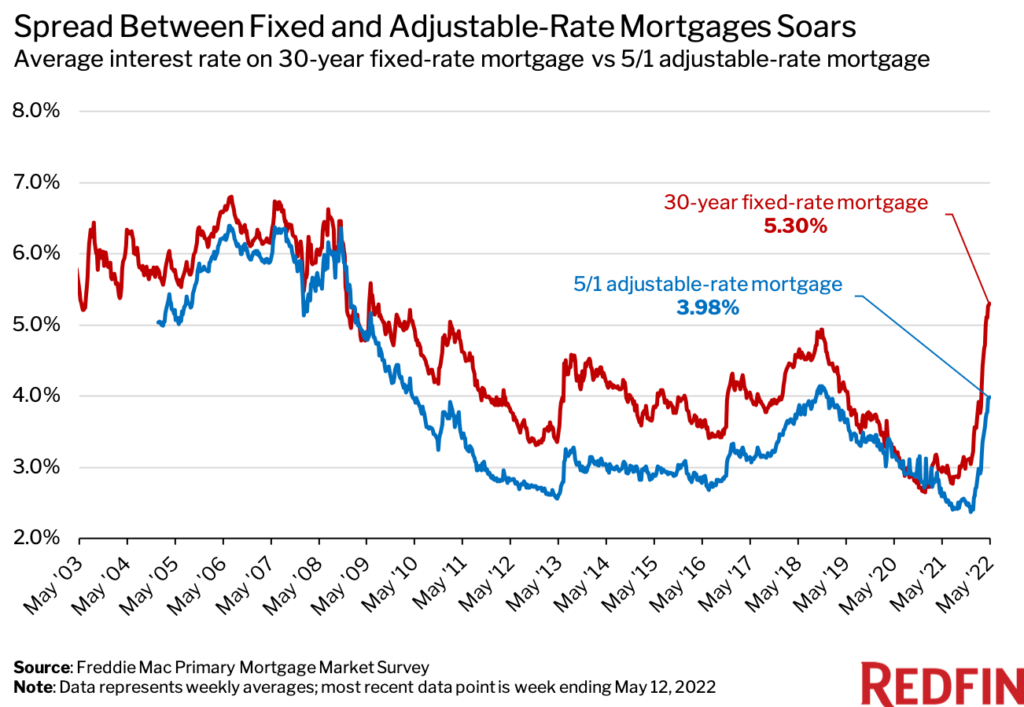
Adjustable-rate mortgages often come with lower interest rates, and therefore lower monthly payments, because buyers only get to lock in their mortgage rate for a certain number of years. They’ve been rising in popularity as mortgage rates have surged at their fastest pace in decades. The average interest rate on a 5/1 ARM was 3.98% during the week ending May 12, while the average rate on a 30-year fixed mortgage was 5.3%—a spread of 1.32 percentage points. That’s just shy of the 1.36-percentage-point spread during the week ending April 21, which was the largest since 2014.

Adjustable-rate mortgages made up 10.8% of all mortgage applications during the week ending May 6. That’s up from 3.1% at the start of the year and the highest share since 2008, when a lack of regulation of ARMs helped contribute to the housing crash. Scores of borrowers were drawn to ARMs in the early 2000s due to their low initial “teaser rates” and option for a 0% down payment. That became problematic when rates reset higher and many buyers could no longer afford their monthly payments. Today, banks do more due diligence to check if buyers will be able to cover the increased costs when the loan resets. For example, Bay Equity Home Loans—Redfin’s mortgage company—requires a down payment of at least 5%, a minimum credit score of 620 and a debt-to-income ratio of no more than 50%. There are also caps on how much lenders can increase interest rates.
Still, ARMs are risky, as it’s challenging to predict where mortgage rates will be when the loan resets. If they’re significantly higher, it may be harder for borrowers to cover their monthly mortgage. For certain types of ARMs, borrowers may face fees or penalties if they refinance or pay off their loan early, Redfin Deputy Chief Economist Taylor Marr explained. If borrowers do consider refinancing, they should calculate whether the closing costs for the refinance negate the savings from the ARM, Marr said.
“Adjustable-rate mortgages can work really well for homebuyers who plan to stay in their home for less than 5 to 10 years and have the means to cover higher payments when the loan resets,” said Arnell Brady, a senior loan officer Bay Equity Home Loans.
Brady said that 20% to 30% of his clients are now asking about adjustable-rate mortgages, a significantly larger share than before the pandemic.
Methodology
Redfin estimated monthly payments on the median-asking-price home for 30-year fixed-rate mortgages and 5/1 adjustable-rate mortgages going back to 2015, the beginning of Redfin’s weekly dataset. Data on median asking prices is from the MLS and covers four-week rolling periods. The median U.S. asking price was $410,700 during the four weeks ending May 12, the most recent period for which data was available. To calculate monthly payments, we paired four-week asking-price data with the average mortgage interest rates during the final week of the period. Mortgage rate data is from Freddie Mac’s Primary Mortgage Market Survey, which is released on a weekly basis. The average interest rate on a 5/1 adjustable-rate mortgage was 3.98% during the week ending May 12, while the average rate on a 30-year fixed-rate mortgage was 5.3%. Redfin’s analysis assumed a down payment of 20%, a property-tax rate of 1.25% and homeowner’s insurance costs equal to 0.5% of the home-sale price.
The mortgage-payment data in this report has been rounded to the nearest integer. The typical monthly mortgage payment for buyers was an estimated $2,423.45 on a 30-year fixed mortgage during the four weeks ending May 12, and $2,163.75 on a 5/1 ARM; the difference between those two numbers is $259.70, which we round up to $260.


 United States
 Canada