The uptick in urban home searches closely trails a 235% increase in searches for homes in rural areas. Home prices were up by double digits in both neighborhood types, reflecting both continued interest in rural life and optimism about the return of city life as the pandemic persists.
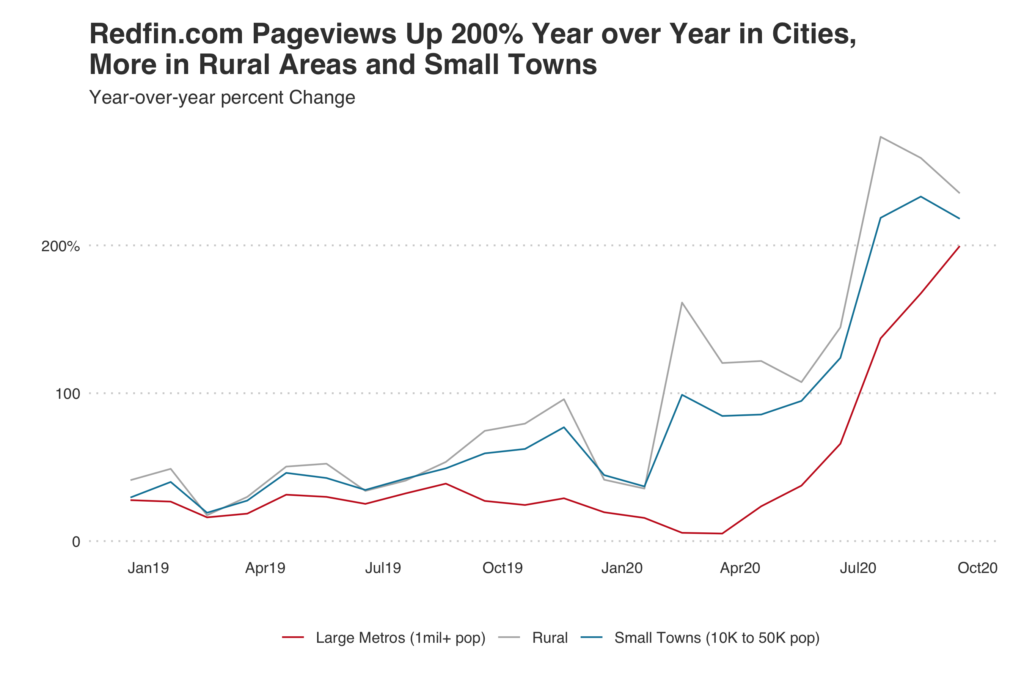
Pageviews of homes in rural areas on Redfin.com increased 235% year over year in October. Although that’s a big bump, it’s a deceleration from a 273% peak in August. The story is similar in small towns, where pageviews rose 218% year over year in October—a major increase, but less of a boom than the 233% peak in September.
Meanwhile, pageviews of homes in large metro areas–which includes cities and their surrounding suburbs–rose 200% year over year in October, the biggest annual increase this year and a mark of renewed interest in urban places since it stagnated in March and April when the coronavirus pandemic hit. Pageviews of homes in large metro areas, rural areas and small towns are converging toward similar year-over-year increases as Redfin.com searches in rural areas and small towns start to settle and cities pick up steam.

“Rural areas and small towns remain desirable—especially for families who need space to accommodate remote work as the pandemic persists—but record-low mortgage rates are motivating people to search in cities, too,” said Redfin chief economist Daryl Fairweather. “Many buyers are crossing their fingers that restaurants, bars and shops may be bustling again in the next year or so, and they’re looking to invest in the eventual resurgence of cities.”
Home prices up 18% year over year in rural areas and nearly 16% in urban areas
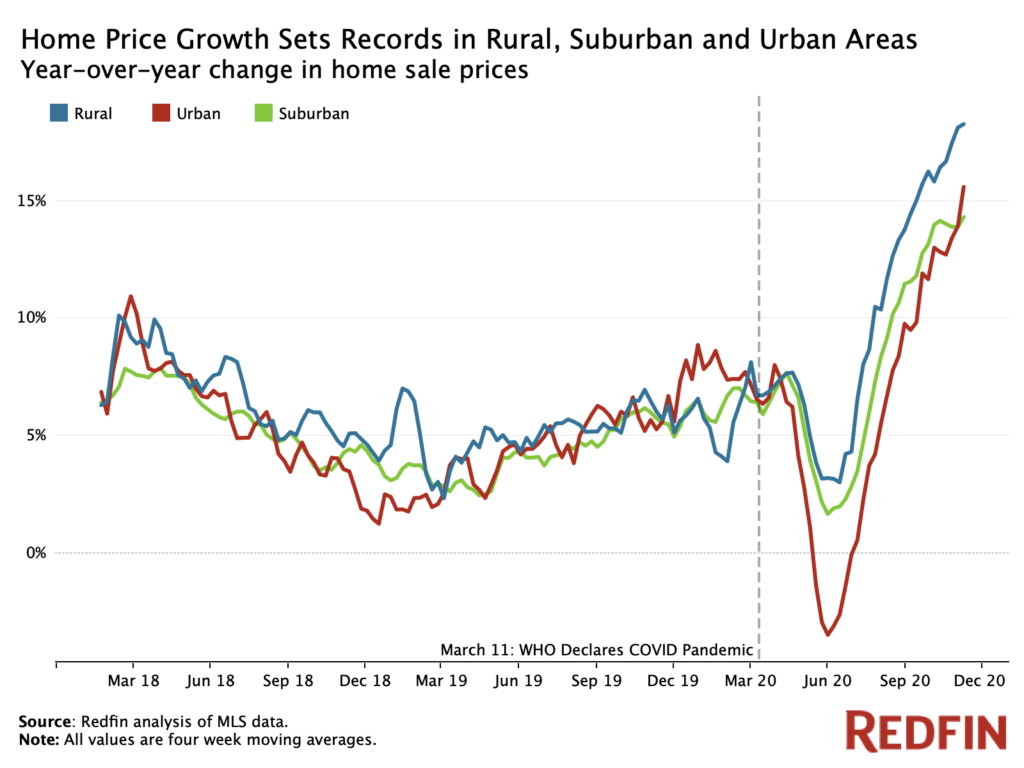
The median home-sale price in rural areas nationwide rose 18.3% year over year to $300,000 in the four weeks ending November 8, the biggest increase and highest median sale price since Redfin started tracking this data in the beginning of 2017. Prices also posted record growth in suburban and urban areas: Suburban areas saw a 14.3% year over year increase to roughly $331,500, while the median sale price in urban areas rose 15.6% to $289,000.
The housing market data in this report divides rural, suburban and urban based on categories from the U.S. Department of Housing and Urban Development, which built a model to describe neighborhood types based on responses to the 2017 American Housing Survey. Note that the categories in this section are different from the categories in the section on Redfin.com pageviews, which divides areas into large metro areas, small towns and rural areas.

Home-price growth stalled in rural, suburban and urban areas in May and June as a result of initial uncertainty stemming from the coronavirus pandemic. Price growth declined 3.5% year over year in May in urban areas, the only neighborhood type where prices dropped. Prices increased 1.6% year over year in the suburbs and 3.2% in rural neighborhoods in May, the month when price growth bottomed out.
The remote work and homeschooling that have come with the pandemic led to a surge in interest in less densely populated areas over the summer, with demand for rural and suburban areas outpacing demand for urban areas. Though the housing market is still hottest in rural neighborhoods, urban areas are making a comeback.
“While life in the city has changed during the pandemic, with empty sidewalks and boarded-up storefronts becoming the norm, some buyers are looking long-term and realizing it’s possible to buy a condo for a 2017 price without competition,” said Jessie Culbert Boucher, a Redfin real estate agent in Seattle. “If they hold onto it for five years, they’ll likely ride out the current downturn, make money and enjoy the return of vibrant city life.”
Total home sales were up 11.4% year over year in rural areas during the four weeks ending November 8, and they were up 15.4% and 9.3% in suburban and urban neighborhoods. Home sales in all three neighborhood types dropped drastically with the onset of the pandemic in the spring. Rural sales were the first to recover, followed closely by suburban and urban areas.

Pending sales, a more current housing market indicator, jumped significantly in all three neighborhood types in October. Pending sales were up 37.4% year over year in rural areas in the four weeks ending November 8, and they were up 36% and 26.1% in suburban areas and urban areas, respectively.
The housing supply shortage is more severe in rural and suburban areas than urban areas, with the number of homes for sale down 40.9% and 31.9% year over year in the four weeks ending November 8, respectively. In urban areas, supply dropped 14.5% year over year. The fact that home supply dropped so significantly in rural and suburban areas reflects intense homebuyer interest in homes outside city centers. Supply is also down by double digits in urban areas, though it’s worth noting that home supply was up 70% year over year in the city of San Francisco in October.
| National Housing Market Summary, Four Weeks Ending November 8 | |||
| Rural areas | Suburban areas | Urban areas | |
| Median sale price | $300,000 | $330,500 | $289,000 |
| Median sale price, YoY | 18.3% | 14.3% | 15.6% |
| Median price per square foot | $149 | $167 | $184 |
| Median price per square foot, YoY | 13.1% | 11.6% | 14.2% |
| Home sales, YoY | 11.4% | 15.4% | 9.3% |
| Pending sales, YoY | 37.4% | 36% | 26.1% |
| Number of homes for sale, YoY | -40.9% | -31.9% | -14.5% |
| New listings, YoY | 8.8% | 13.4% | 13.7% |


 United States
 Canada