Pending sales have stabilized following months of steep declines, but homebuyer demand remains below pre-pandemic levels as house hunters grapple with elevated mortgage rates, high prices and a lack of supply.
Pending home sales inched up in July—rising 0.7% from a month earlier to the highest level since the start of the year on a seasonally adjusted basis. Still, they were only 5.4% above the low point they hit in March. Pending sales fell 15.7% year over year, the smallest annual decline since last summer.

Pending sales have stabilized as the shock of elevated mortgage rates has subsided. They dropped to 367,000 in March—the lowest since the onset of the pandemic—and have been hovering around that level ever since (they clocked in at 387,000 in July) as prospective buyers continue to be discouraged by high housing costs and a lack of homes for sale.
“Home sales hit a bottom in 2022 and haven’t meaningfully budged since,” said Redfin Chief Economist Daryl Fairweather. “Fading recession fears and the prospect of further home price increases have brought some house hunters off the sidelines, but for the most part, buyers remain hesitant to jump into the market because their buying power is so much lower than it was a year ago.”
The average 30-year-fixed mortgage rate was 6.84% in July, up from 6.71% a month earlier and 5.41% a year earlier—and it has climbed even higher since. As of Thursday, it was 7.23%—the highest since 2001. That, along with stubbornly high home prices, has sent the typical homebuyer’s monthly mortgage payment up substantially from a year ago.
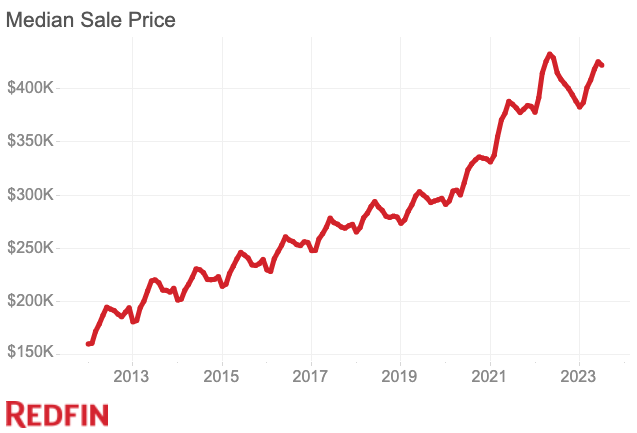
The median home sale price rose 1.7% year over year to $421,872 in July—the first annual increase since the start of the year. That’s just 2.5% below the record high of $432,476 set in May 2022.

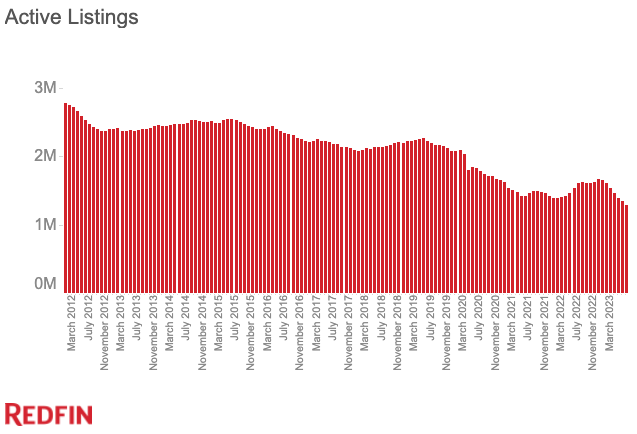
Housing prices have remained high despite sluggish homebuyer demand because there are so few homes on the market, meaning the buyers who are out there are frequently competing for a small pool of properties. The total number of homes for sale (active listings) fell 3.9% month over month in July to the lowest level on record on a seasonally adjusted basis, and dropped 19.5% from a year earlier. That’s the biggest annual decline in more than two years.
“It’s a seller’s market, but only because there’s so little inventory,” said Salt Lake City Redfin Premier real estate agent Mitch Price. “Buyers are getting hammered by high interest rates, so they’re not just jumping on whatever is available like they were before. They don’t want to overpay, so they’re waiting for the right home. As a seller, if you overprice your home, that’s your doomsday ticket.”
Housing supply is dwindling because high mortgage rates are dissuading homeowners from selling. New listings in July were little changed from a month earlier, rising 0.5% on a seasonally adjusted basis, but they were down 22.2% from a year earlier. Nearly every U.S. homeowner with a mortgage has an interest rate below 6%, prompting most to stay put because selling and buying a new home would likely mean taking on a much higher monthly payment.

July 2023 Highlights
| July 2023 | Month-Over-Month Change | Year-Over-Year Change | |
| Median sale price | $421,872 | -0.8% | 1.7% |
| Pending sales, seasonally adjusted | 387,374 | 0.7% | -15.7% |
| Homes sold, seasonally adjusted | 421,244 | 0.5% | -13.5% |
| New listings, seasonally adjusted | 465,301 | 0.5% | -22.2% |
| All homes for sale, seasonally adjusted (active listings) | 1,294,987 | -3.9% | -19.5% |
| Months of supply | 2.2 | 0.3 | -0.2 |
| Median days on market | 29 | 0 | 8 |
| Share of for-sale homes with a price drop | 16.6% | 1.6 ppts | -2.5 ppts |
| Share of homes sold above final list price | 38.2% | -1.5 ppts | -9.0 ppts |
| Average sale-to-final-list-price ratio | 100.1% | -0.2 ppts | -0.9 ppts |
| Share of home offers written by Redfin agents that faced competition, seasonally adjusted | 50.5% | 0.0 ppts | 2.5 ppts |
| Pending sales that fell out of contract, as % of overall pending sales | 15.5% | 0.4 ppts | 1.0 ppts |
| Average 30-year fixed mortgage rate | 6.84% | 0.13 ppts | 1.43 ppts |
Note: Data is subject to revision
Metro-Level Highlights: July 2023
Data in the bullets below came from a list of the 91 U.S. metro areas with populations of at least 750,000. Select metros may be excluded from time to time to ensure data accuracy. A full metro-level data table can be found in the “download” tab of the dashboard embedded below or in the monthly section of the Redfin Data Center. Refer to our metrics definition page for explanations of metrics used in this report. Metro-level data is not seasonally adjusted.
- Pending sales: In Bridgeport, CT, pending sales fell 55.1% year over year, more than any other metro Redfin analyzed. Next came Baton Rouge, LA (-52.6%) and New Haven, CT (-52.5%). Only one metro saw an increase: Atlanta (2%). The smallest declines were in Detroit (-1.2%) and El Paso, TX (-1.2%).
- Closed sales: In New Haven, closed home sales dropped 30.5% year over year, more than any other metro Redfin analyzed. Next came Bridgeport (-30.3%) and Providence, RI (-29.2%). Closed sales rose in just one metro—North Port, FL (4.3%)—and fell least in Las Vegas (-2.2%) and Austin, TX (-3.6%).
- Prices: Median sale prices fell from a year earlier in 28 of the metros Redfin analyzed. The biggest declines were in Austin (-10.5%), Detroit (-7%) and Honolulu (-6.2%). The biggest increases were in Dayton, OH (12.2%), Miami (11.7%) and Camden, NJ (9.7%).
- Listings: New listings fell most from a year earlier in Bridgeport (-51.4%), Greensboro, NC (-50.5%) and Hartford, CT (-49.6%). They rose in one metro— McAllen, TX (2.5%)—and fell least in El Paso (-8.1%) and Rochester, NY (-10.4%).
- Supply: Active listings fell most from a year earlier in Bridgeport (-49.8%), Boise, ID (-47.2%) and Hartford (-46.7%). They rose most in New Orleans (33.4%), McAllen (30.7%) and Cape Coral, FL (18.1%).
- Competition: In Rochester, 78.8% of homes sold above their final list price, the highest share among the metros Redfin analyzed. Next came Hartford (74.3%) and Buffalo, NY (71.8%). The shares were lowest in North Port (9.3%), Cape Coral (10.6%) and West Palm Beach, FL (13.3%).


 United States
 Canada