Daily average mortgage rates jumped to their highest level since last November after last week’s disappointing inflation report. Persistently high home prices are exacerbating affordability challenges for buyers.
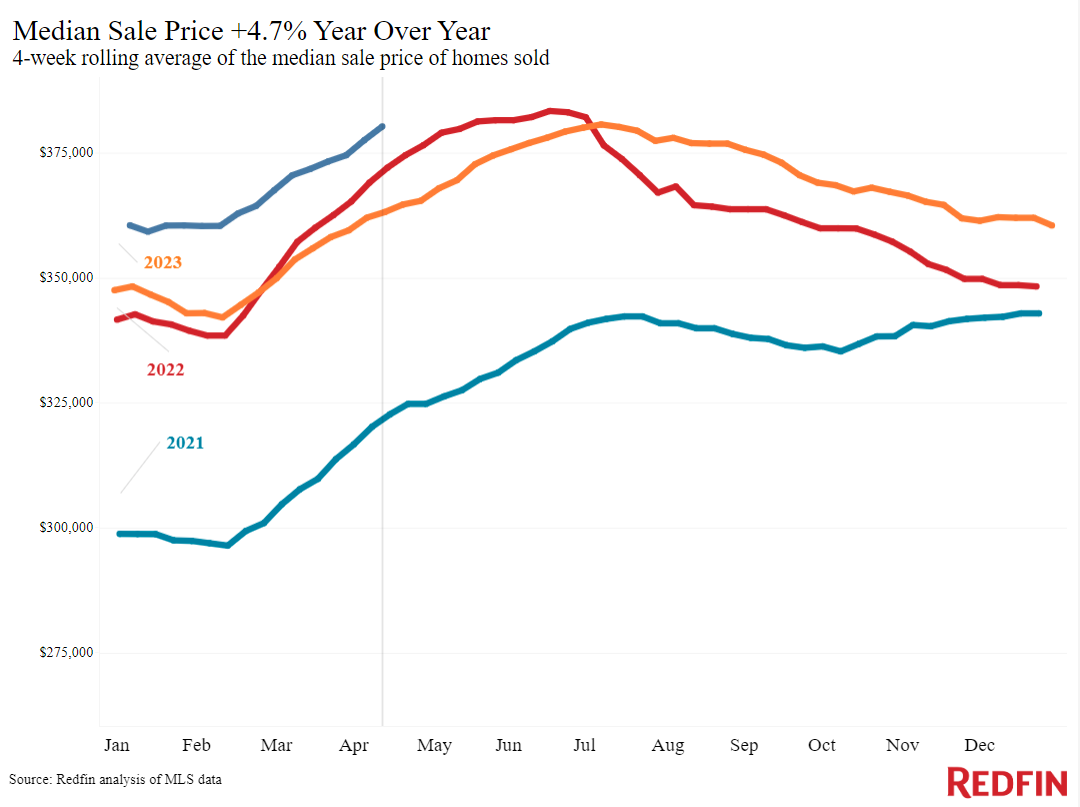
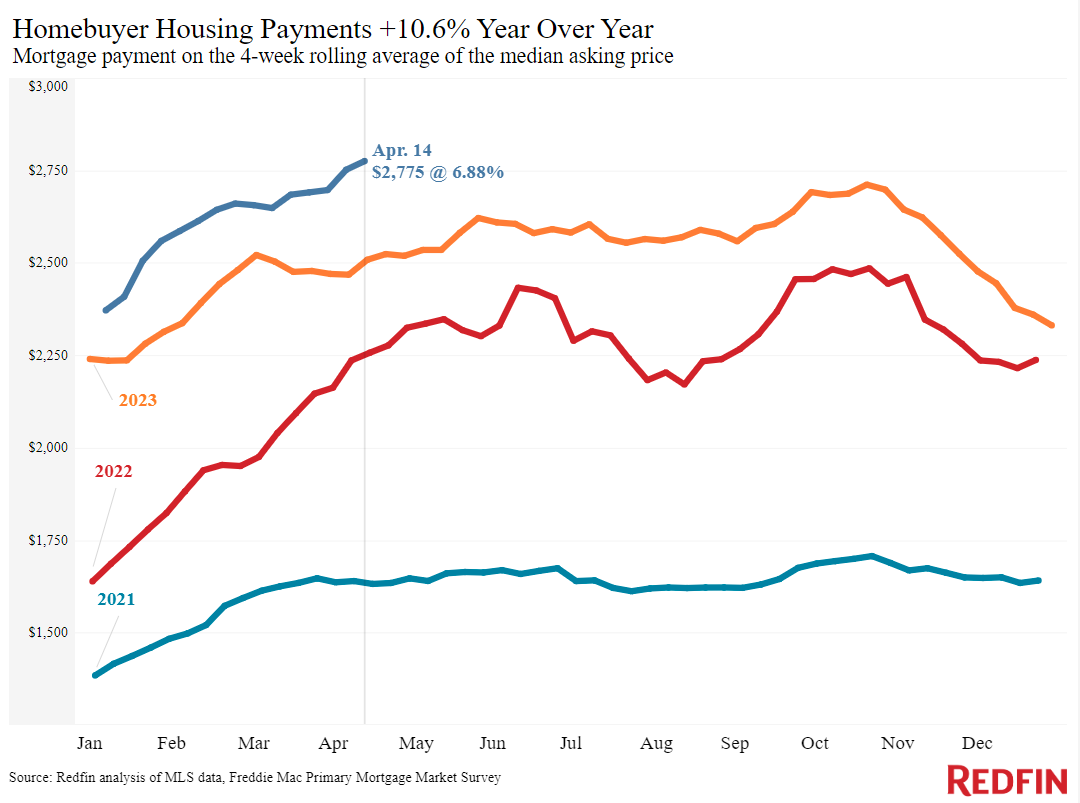
The average daily mortgage rate this week surpassed 7.4%, the highest level since last November, after a hotter-than-expected inflation report and the Fed’s confirmation that interest-rate cuts will be delayed. Home prices are rising, too: The median U.S. home-sale price increased 5% from a year earlier during the four weeks ending April 14, bringing it to $380,250—just $3,095 shy of June 2022’s all-time high. The combination of high mortgage rates and prices have brought homebuyers’ median monthly housing payment to a record $2,775, up 11% year over year.
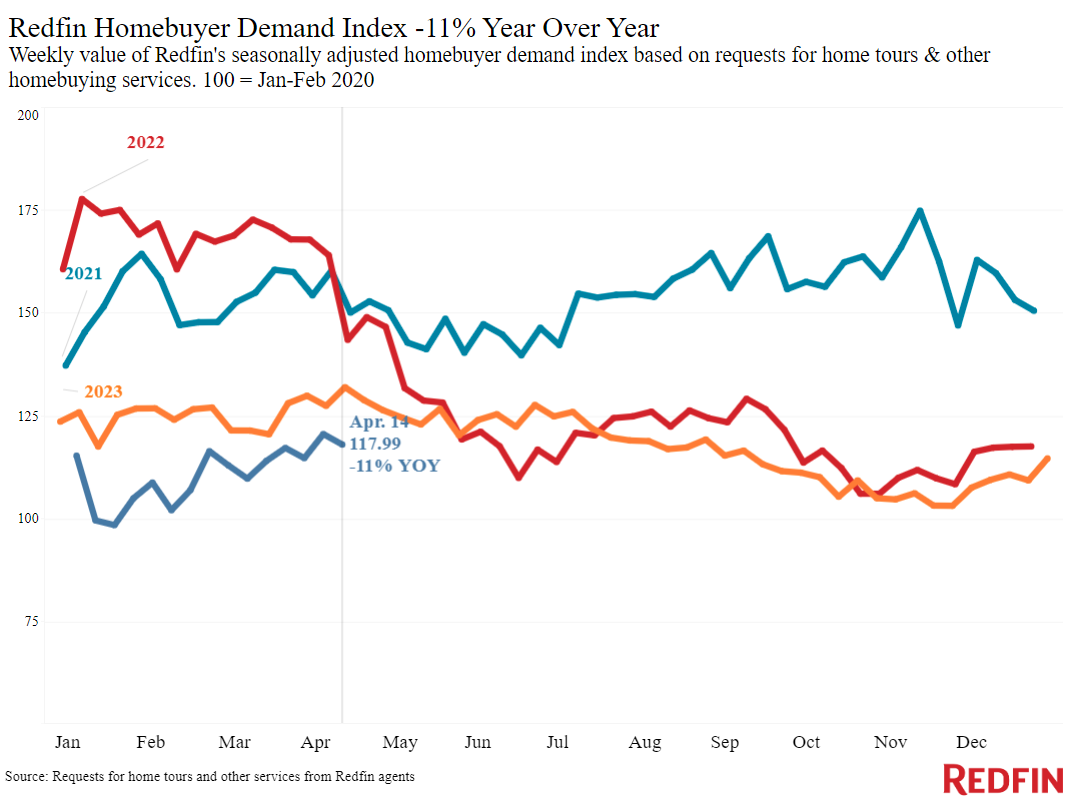
There are signals that buyers are out there touring homes despite rising rates. Mortgage-purchase applications are up 5% week over week, and Redfin’s Homebuyer Demand Index–a measure of requests for tours and other buying services from Redfin agents–is near its highest level in seven months. Chen Zhao, Redfin’s economic research lead, said some house hunters are hoping to buy now because they’re concerned rates could rise more, and others have grown accustomed to elevated rates and pushed down their home-price budget accordingly.
“Home sales are slower than usual, but there are still people buying and selling because if not now, when?” said Connie Durnal, a Redfin Premier agent in Dallas. “I’ve had a few prospective buyers touring homes for the last several years, since mortgage rates started going up, and they wish they would have bought last year because prices and rates are even higher now. My advice to them: If you can afford to and you find a house you love, buy now. There’s no guarantee that rates will come down soon.”
For more of Redfin economists’ takes on the housing market, including how current financial events are impacting mortgage rates, please visit Redfin’s “From Our Economists” page.
Leading indicators
| Indicators of homebuying demand and activity | ||||
| Value (if applicable) | Recent change | Year-over-year change | Source | |
| Daily average 30-year fixed mortgage rate | 7.41% (April 17) | Up from 7% one month earlier; highest level since November 2023 | Up from 6.61% | Mortgage News Daily |
| Weekly average 30-year fixed mortgage rate | 6.88% (week ending April 11) | Up just slightly from 6.82% a week earlier | Up from 6.27% | Freddie Mac |
| Mortgage-purchase applications (seasonally adjusted) | Increased 5% from a week earlier (as of week ending April 12) | Down 10% | Mortgage Bankers Association | |
| Redfin Homebuyer Demand Index (seasonally adjusted) | Up 8% from a month earlier (as of week ending April 14) | Down 11% | Redfin Homebuyer Demand Index, a measure of requests for tours and other homebuying services from Redfin agents | |
| Touring activity | Up 33% from the start of the year (as of April 14) | At this time last year, it was up 23% from the start of 2023 | ShowingTime, a home touring technology company | |
| Google searches for “home for sale” | Unchanged from a month earlier (as of April 14) | Down 17% | Google Trends | |
Key housing-market data
| U.S. highlights: Four weeks ending April 14, 2024
Redfin’s national metrics include data from 400+ U.S. metro areas, and is based on homes listed and/or sold during the period. Weekly housing-market data goes back through 2015. Subject to revision. |
|||
| Four weeks ending April 14, 2024 | Year-over-year change | Notes | |
| Median sale price | $380,250 | 4.7% | |
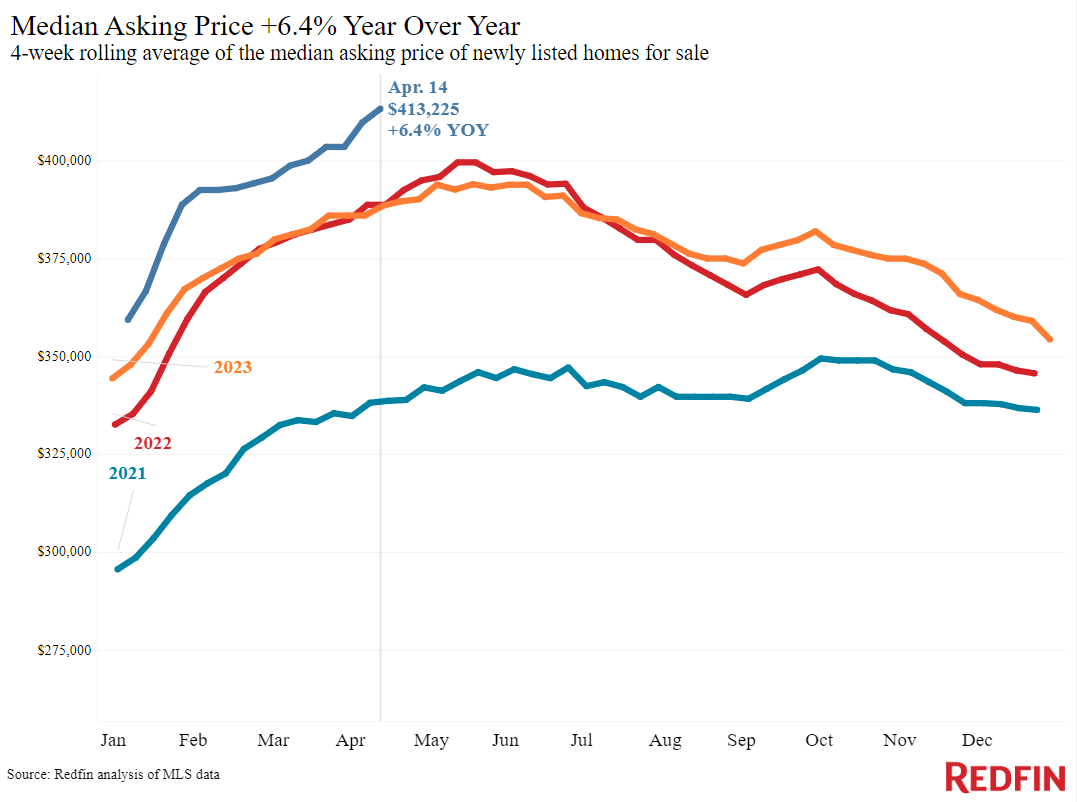
| Median asking price | $413,225 | 6.4% | Biggest increase since Oct. 2022; all-time high |
| Median monthly mortgage payment | $2,775 at a 6.88% mortgage rate | 10.6% | All-time high |
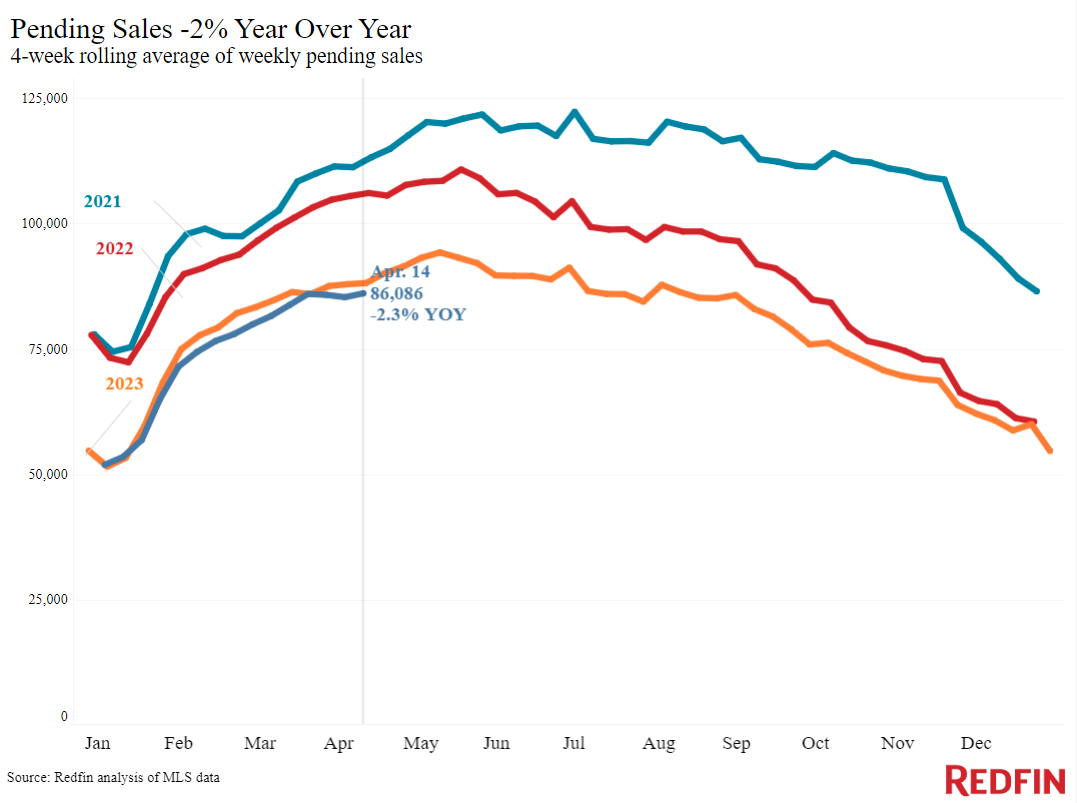
| Pending sales | 86,086 | -2.3% | |
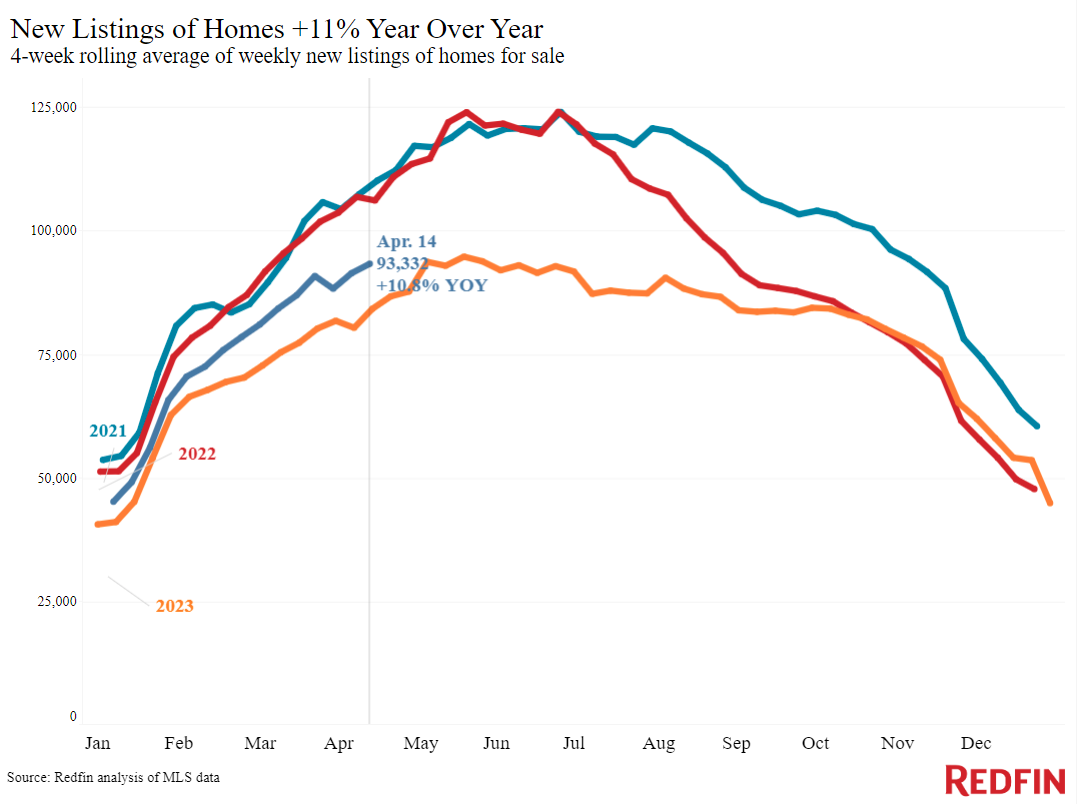
| New listings | 93,332 | 10.8% | |
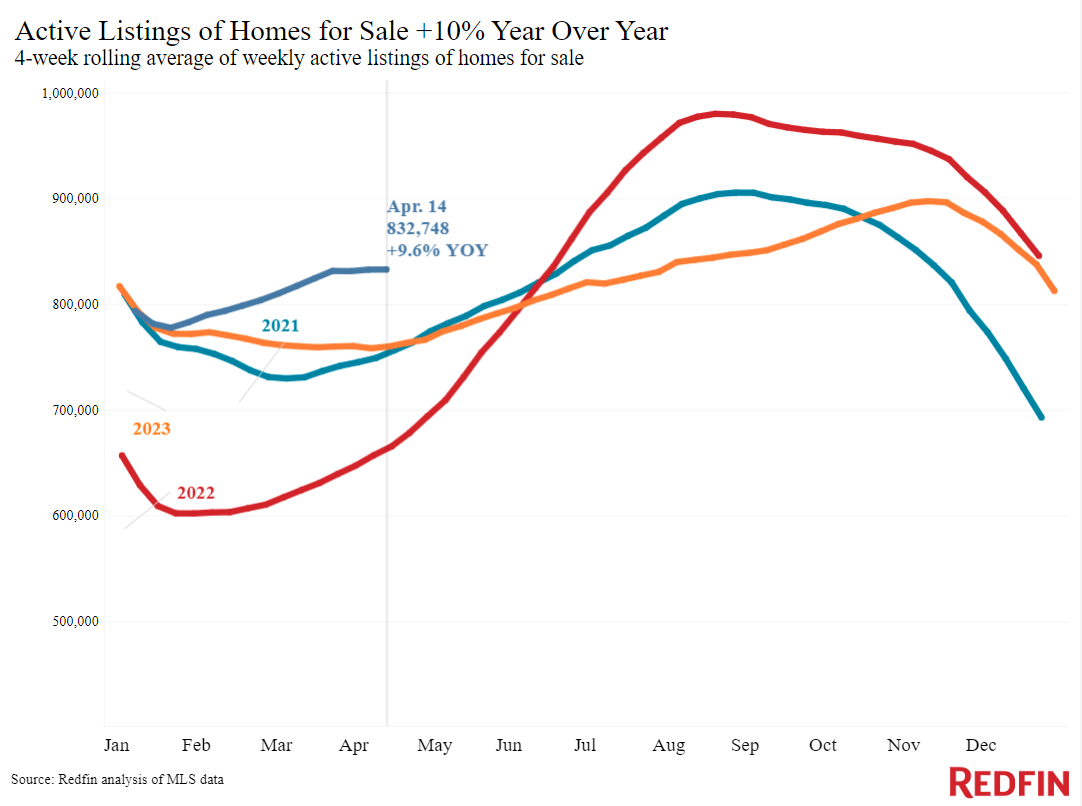
| Active listings | 832,748 | 9.6% | |
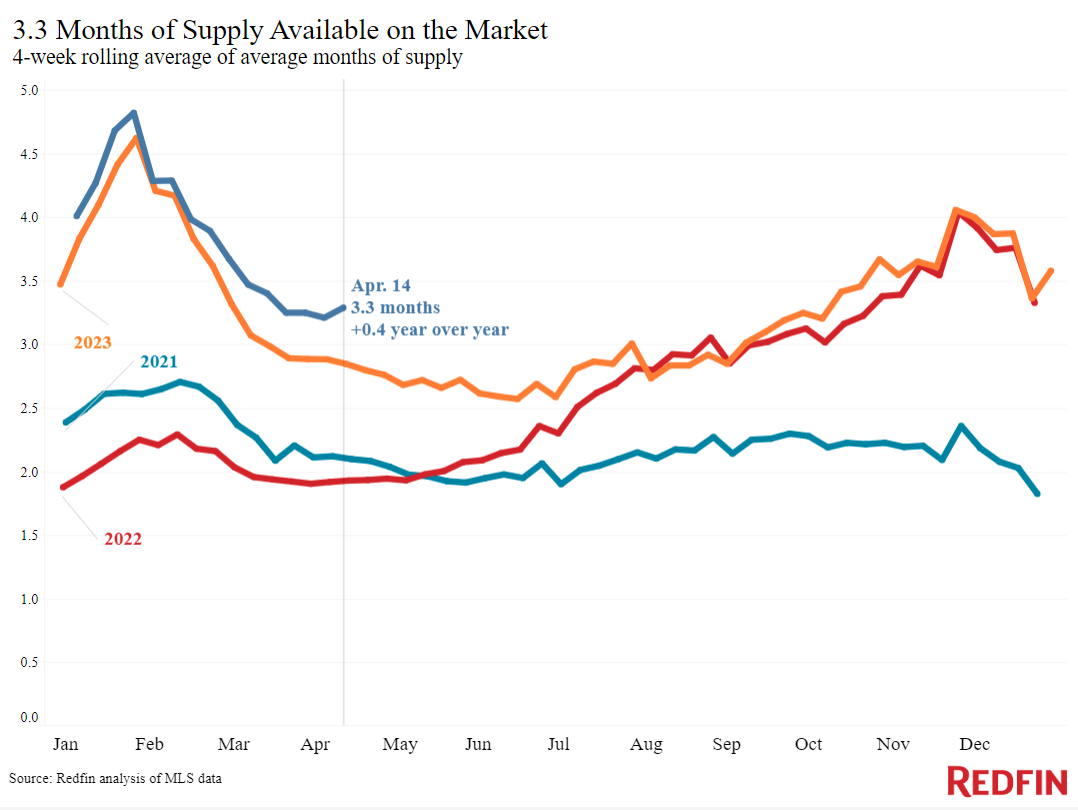
| Months of supply | 3.3 months | +0.4 pts. | 4 to 5 months of supply is considered balanced, with a lower number indicating seller’s market conditions. |
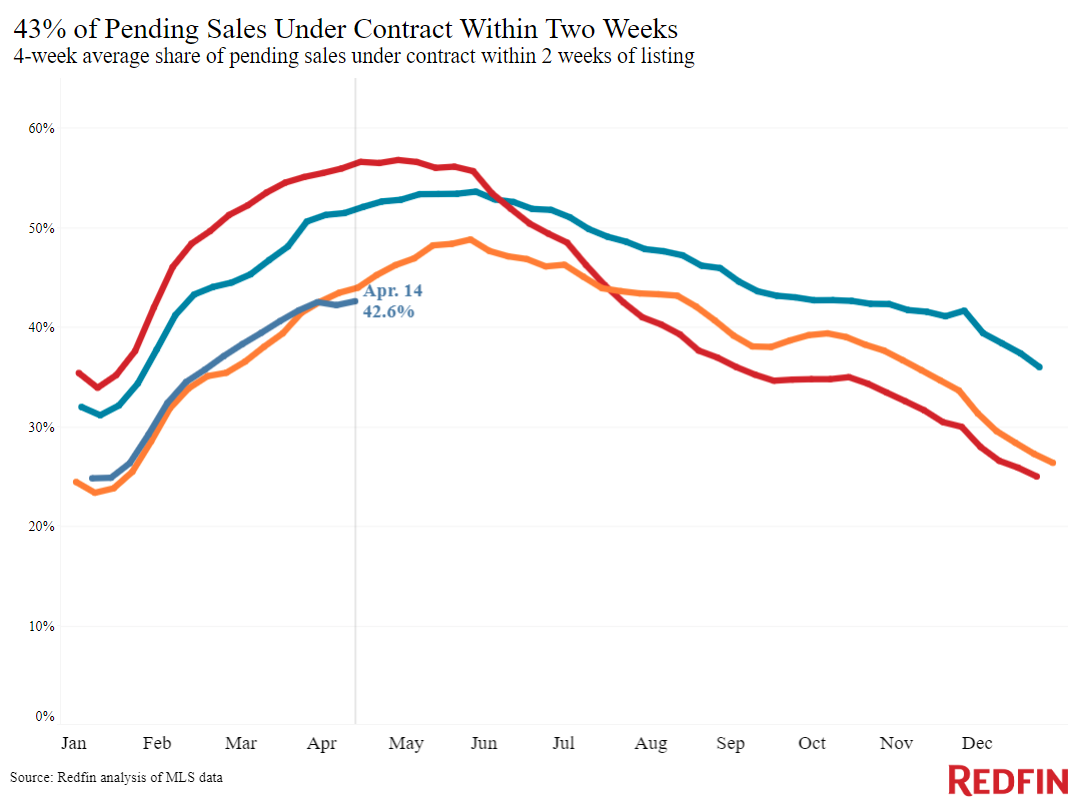
| Share of homes off market in two weeks | 42.6% | Down from 44% | |
| Median days on market | 35 | -1 day | |
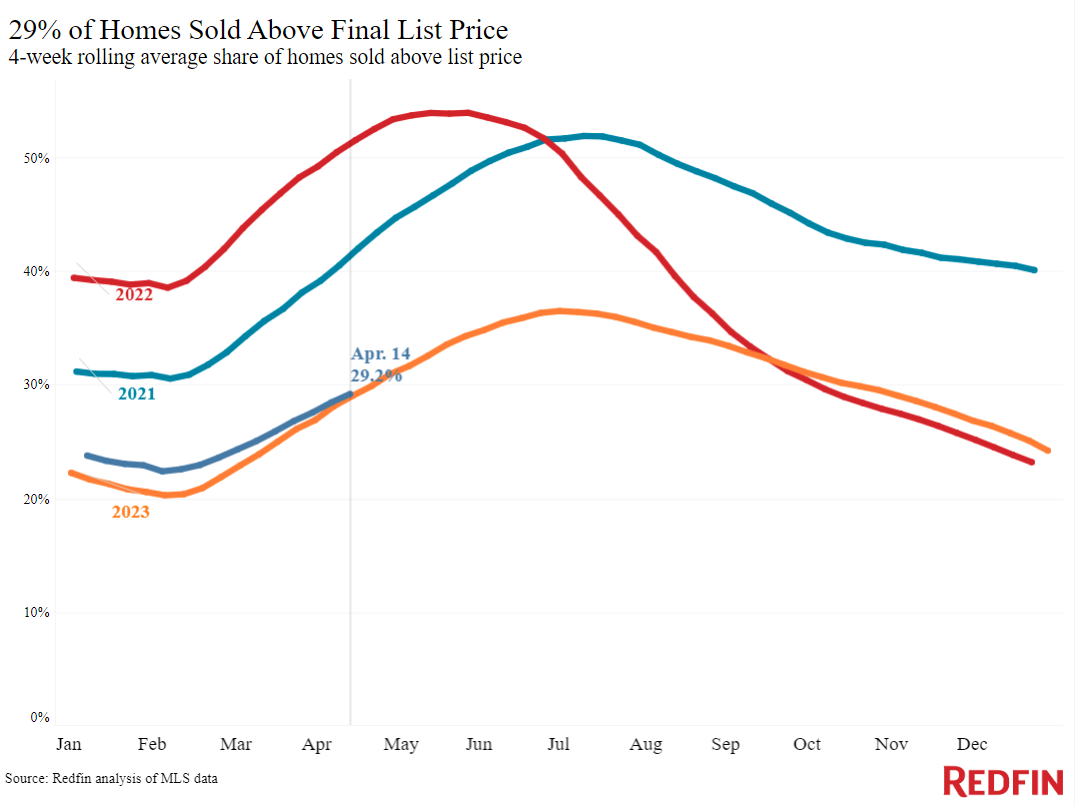
| Share of homes sold above list price | 29.2% | Essentially unchanged | |
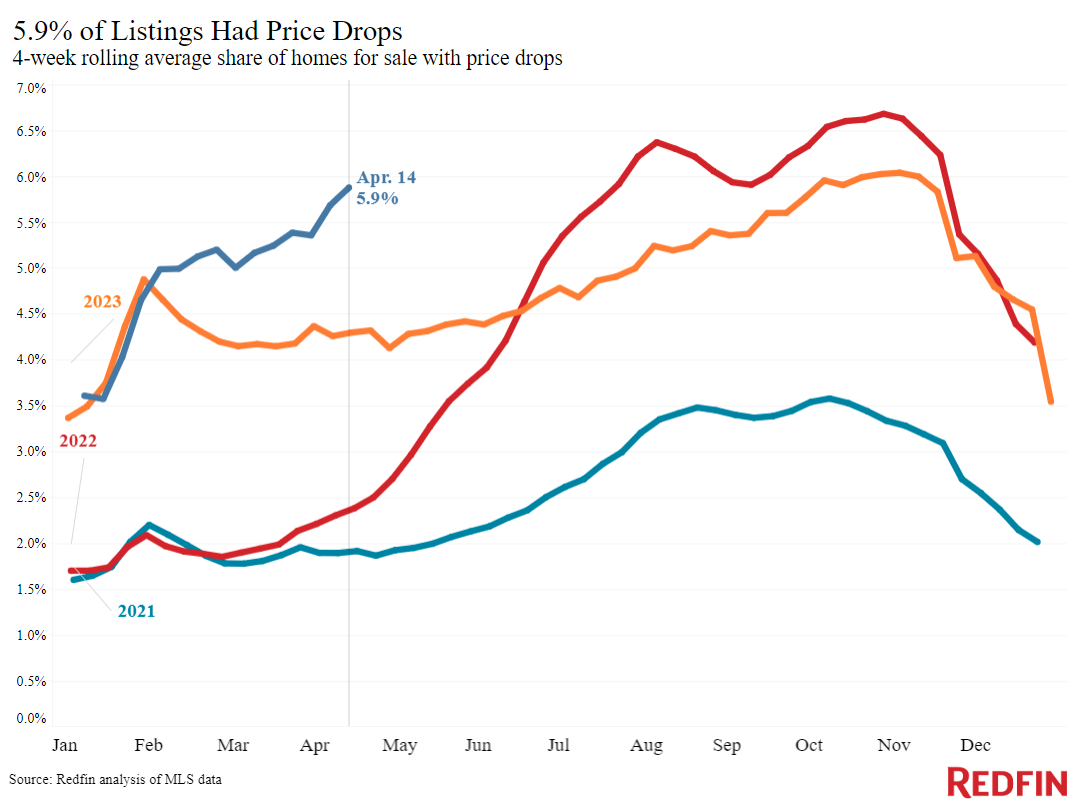
| Share of homes with a price drop | 5.9% | +1.6 pts. | |
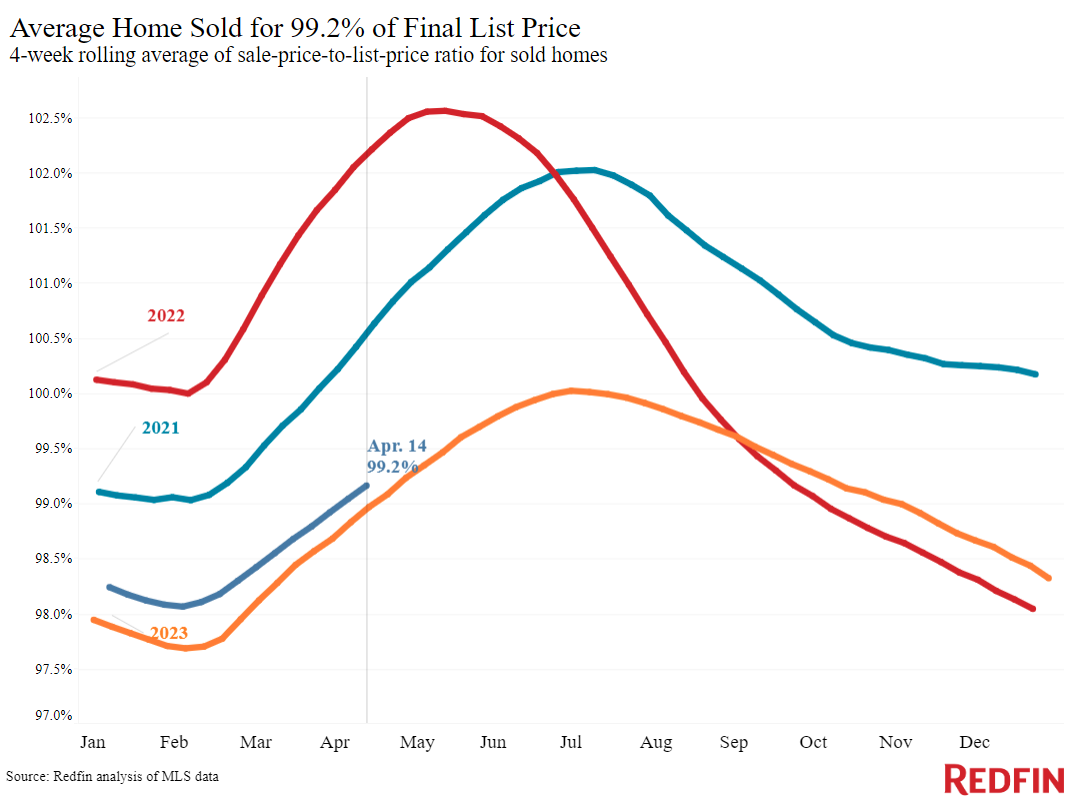
| Average sale-to-list price ratio | 99.2% | +0.2 pts. | |
|
Metro-level highlights: Four weeks ending April 14, 2024 Redfin’s metro-level data includes the 50 most populous U.S. metros. Select metros may be excluded from time to time to ensure data accuracy. |
|||
|---|---|---|---|
| Metros with biggest year-over-year increases | Metros with biggest year-over-year decreases | Notes | |
| Median sale price | Anaheim, CA (24.8%)
Providence, RI (14.6%) Nassau County, NY (14.3%) West Palm Beach, FL (13.5%) New Brunswick, NJ (13.1%) |
San Antonio, TX (-1%) |
Declined in just 1 metro |
| Pending sales | San Jose, CA (25.6%)
San Francisco (11.2%) Oakland, CA (7.1%) Columbus, OH (6.7%) Seattle (6.4%) |
Nassau County, NY (-14.9%)
Atlanta (-13.6%) Houston (-11.6%) Riverside, CA (-10.8%) Fort Lauderdale, FL (-10%) |
Increased in 14 metros |
| New listings | San Jose, CA (46.6%)
Sacramento, CA (27.6%) Phoenix (27.4%) Jacksonville, FL (27.2%) Dallas (22.9%) |
Newark, NJ (-12.4%)
Providence, RI (-6.3%) Milwaukee (-4.6%) Chicago (-4.5%) Detroit (-3.1%) |
Declined in 9 metros |
Refer to our metrics definition page for explanations of all the metrics used in this report.