Mortgage rates dropped to their lowest level since February after the latest CPI report showed inflation cooling. Still, pending home sales posted their biggest decline in eight months.
Daily average mortgage rates have dropped to their lowest level since February after last week’s cooler-than-expected inflation report, bringing homebuyers a bit of relief.
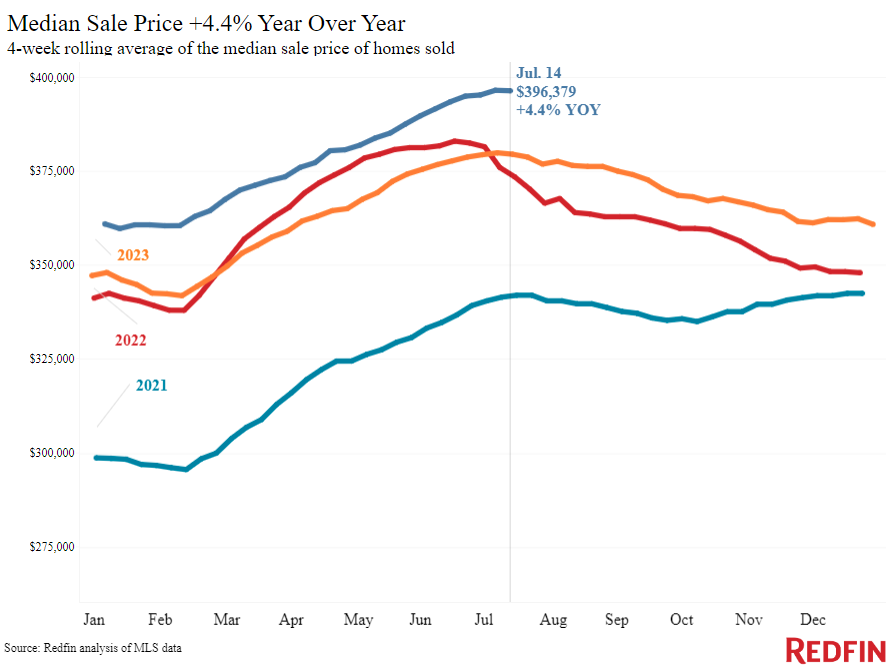
A homebuyer on a $3,000 monthly budget can afford a $450,000 home with a 6.8% mortgage rate, roughly the daily average as of July 17. That buyer has gained about $25,000 in purchasing power since rates hit a five-month peak in April, when they could have bought a $425,000 home with a 7.5% rate. To look at affordability another way, the typical U.S. homebuyer’s monthly housing payment was $2,722 during the four weeks ending July 14, $115 lower than April’s all-time high. That’s despite home prices sitting just about $100 shy of last week’s record high.
Rising supply is another piece of promising news for homebuyers, with new listings up 6.4% year over year and the total number of listings near its highest level in almost four years. More homeowners are selling because they’re tired of waiting for rates to drop significantly; it has been more than two years since they started rising from pandemic-era lows.
Buyers have yet to react strongly to falling rates and increasing inventory. Pending sales are down 5.6% year over year, the biggest decline in eight months, and Redfin’s Homebuyer Demand Index–a measure of requests for tours and other buying services from Redfin agents–is down 15%. Mortgage-purchase applications are down 3% week over week on a seasonally adjusted basis. That’s despite mortgage rates falling year over year; the 6.83% daily average as of July 17 is down from 6.9% a year ago. Some buyers are sitting on the sidelines because they’re hoping mortgage rates will decline more.
“Now that it’s looking increasingly likely the Fed will cut interest rates by the end of the year, some house hunters believe mortgage rates will fall more and are waiting for that to happen before they buy,” said Chen Zhao, Redfin’s economic research lead. “But they may be waiting in vain; it’s unlikely mortgage rates will drop much lower in the next few months, as markets are already pricing in the expectation of a rate cut in September, followed by several more at the end of 2024 and into 2025. In fact, now may be the right time for house hunters to get serious about making offers before prices increase even more and they lose some power. Plus, there are more homes to choose from, and many listings are growing stale, giving buyers an opportunity to negotiate.”
Another reason for slow demand is extreme heat in some parts of the country preventing house hunters from touring. Nashville, TN Redfin Premier agent Kristin Sanchez said: “Severe heat waves are making people feel pretty much locked in their houses. They don’t want to come out to see homes because it’s miserable outside; open houses haven’t been getting much traffic.”
For more on Redfin economists’ takes on the housing market, please visit Redfin’s “From Our Economists” page.
Leading indicators
| Indicators of homebuying demand and activity | ||||
| Value (if applicable) | Recent change | Year-over-year change | Source | |
| Daily average 30-year fixed mortgage rate | 6.83% (July 17) | Lowest level since February; down from 7.14% 2 weeks earlier | Down from 6.9% | Mortgage News Daily |
| Weekly average 30-year fixed mortgage rate | 6.89% (week ending July 11) | Down from 6.95% a week earlier | Down from 6.96% | Freddie Mac |
| Mortgage-purchase applications (seasonally adjusted) | Decreased 3% from a week earlier (as of week ending July 12) | Down 14% | Mortgage Bankers Association | |
| Redfin Homebuyer Demand Index (seasonally adjusted) | Up 3% from a month earlier (as of week ending July 14) | Down 15% | Redfin Homebuyer Demand Index, a measure of requests for tours and other homebuying services from Redfin agents | |
| Touring activity | Up 26 from the start of the year (as of July 14) | At this time last year, it was up 19% from the start of 2023 | ShowingTime, a home touring technology company | |
| Google searches for “home for sale” | Up 4% from a month earlier (as of July 15) | Down 20% | Google Trends | |
Key housing-market data
| U.S. highlights: Four weeks ending July 14, 2024
Redfin’s national metrics include data from 400+ U.S. metro areas, and is based on homes listed and/or sold during the period. Weekly housing-market data goes back through 2015. Subject to revision. |
|||
| Four weeks ending July 14, 2024 | Year-over-year change | Notes | |
| Median sale price | $396,379 | 4.4% | Just about $100 shy of last week’s all-time high |
| Median asking price | $404,998 | 5.2% | |
| Median monthly mortgage payment | $2,722 at a 6.89% mortgage rate | 6.1% | $115 below all-time high set during the 4 weeks ending April 28 |
| Pending sales | 81,297 | -5.6% | Biggest decline in 8 months |
| New listings | 93,676 | 6.4% | |
| Active listings | 977,230 | 18.4% | Smallest increase in 3 months |
| Months of supply | 3.6 | +0.7 pts. | 4 to 5 months of supply is considered balanced, with a lower number indicating seller’s market conditions. |
| Share of homes off market in two weeks | 39.1% | Down from 44% | |
| Median days on market | 32 | +4 days | |
| Share of homes sold above list price | 31.6% | Down from 36% | |
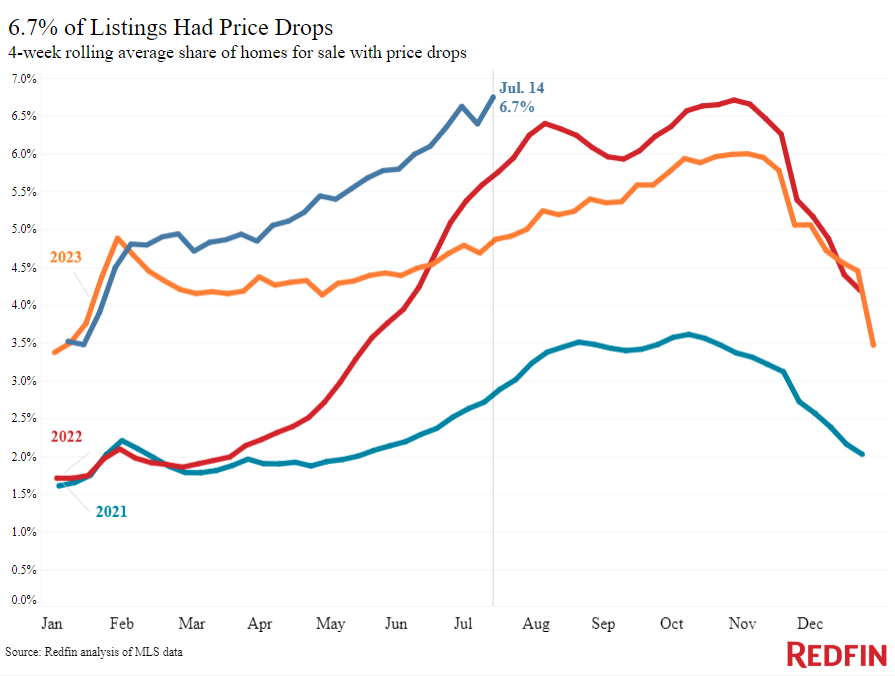
| Share of homes with a price drop | 6.7% | +1.8 pts. | Highest level on record |
| Average sale-to-list price ratio | 99.5% | -0.5 pts. | |
| Metro-level highlights: Four weeks ending July 14, 2024
Redfin’s metro-level data includes the 50 most populous U.S. metros. Select metros may be excluded from time to time to ensure data accuracy. |
|||
|---|---|---|---|
| Metros with biggest year-over-year increases | Metros with biggest year-over-year decreases | Notes | |
| Median sale price | Detroit (16.3%)
Fort Lauderdale, FL (14.4%) West Palm Beach, FL (13.9%) Providence, RI (13.4%) New Brunswick, NJ (12.3%) |
Dallas (-2.3%)
Austin, TX (-2.1%) |
Declined in 2 metros |
| Pending sales | San Jose, CA (9.6%)
San Francisco (7.1%) Boston (4.5%) Newark, NJ (3.5%) Cincinnati, OH (2.4%) |
Houston (-24.4%)
West Palm Beach, FL (-16.9%) Minneapolis (-16.2%) Virginia Beach, VA (-13.4%) Atlanta (-12.9%) |
Increased in 7 metros |
| New listings | San Jose, CA (30.3%)
Las Vegas (19.7%) Miami (18.9%) Jacksonville, FL (17.4%) Seattle (15.6%) |
Atlanta (-13.1%)
Houston (-6.6%) Warren, MI (-5.1%) Detroit (-4.5%) Minneapolis (-3.2%) |
Declined in 8 metros |
Refer to our metrics definition page for explanations of all the metrics used in this report.


 United States
 Canada