Rising mortgage rates may start to become more of a deterrent than a motivator for homebuyers.
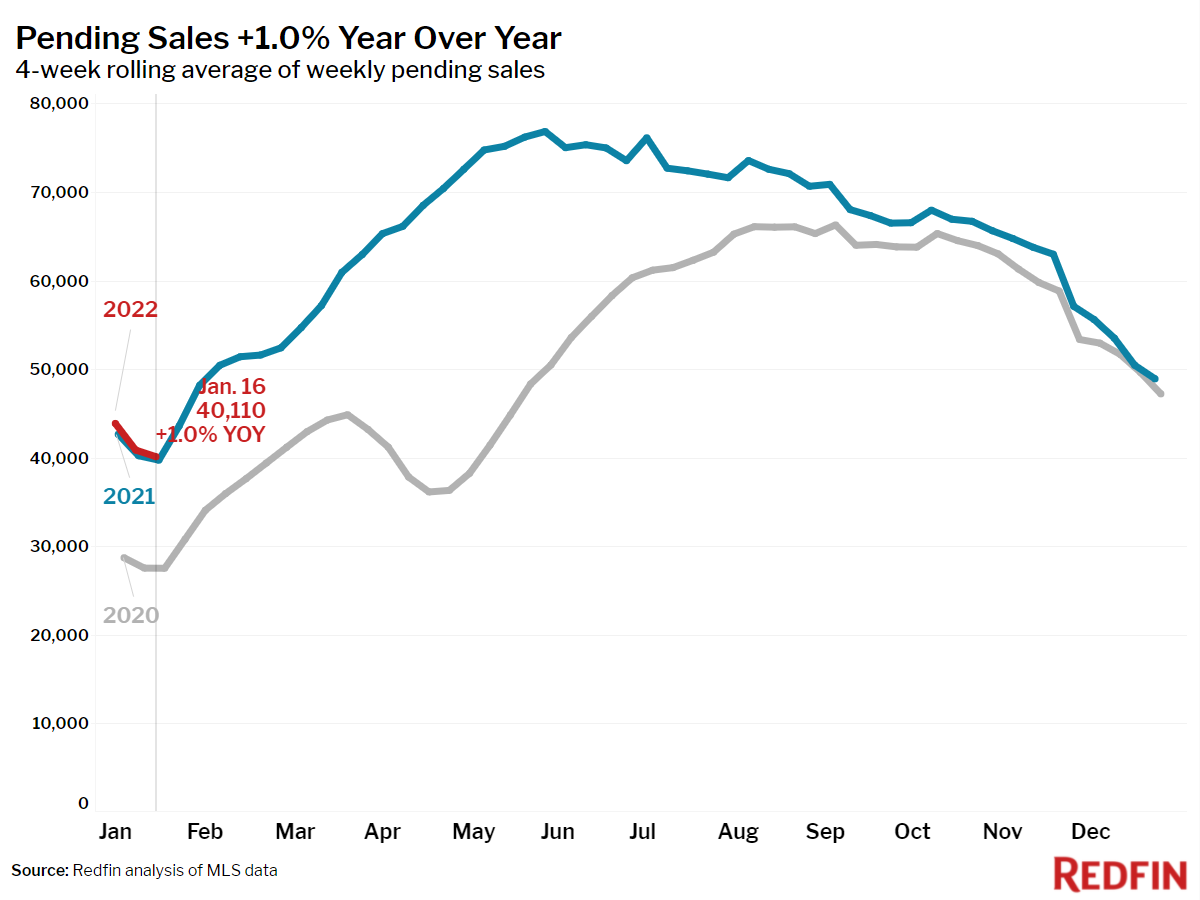
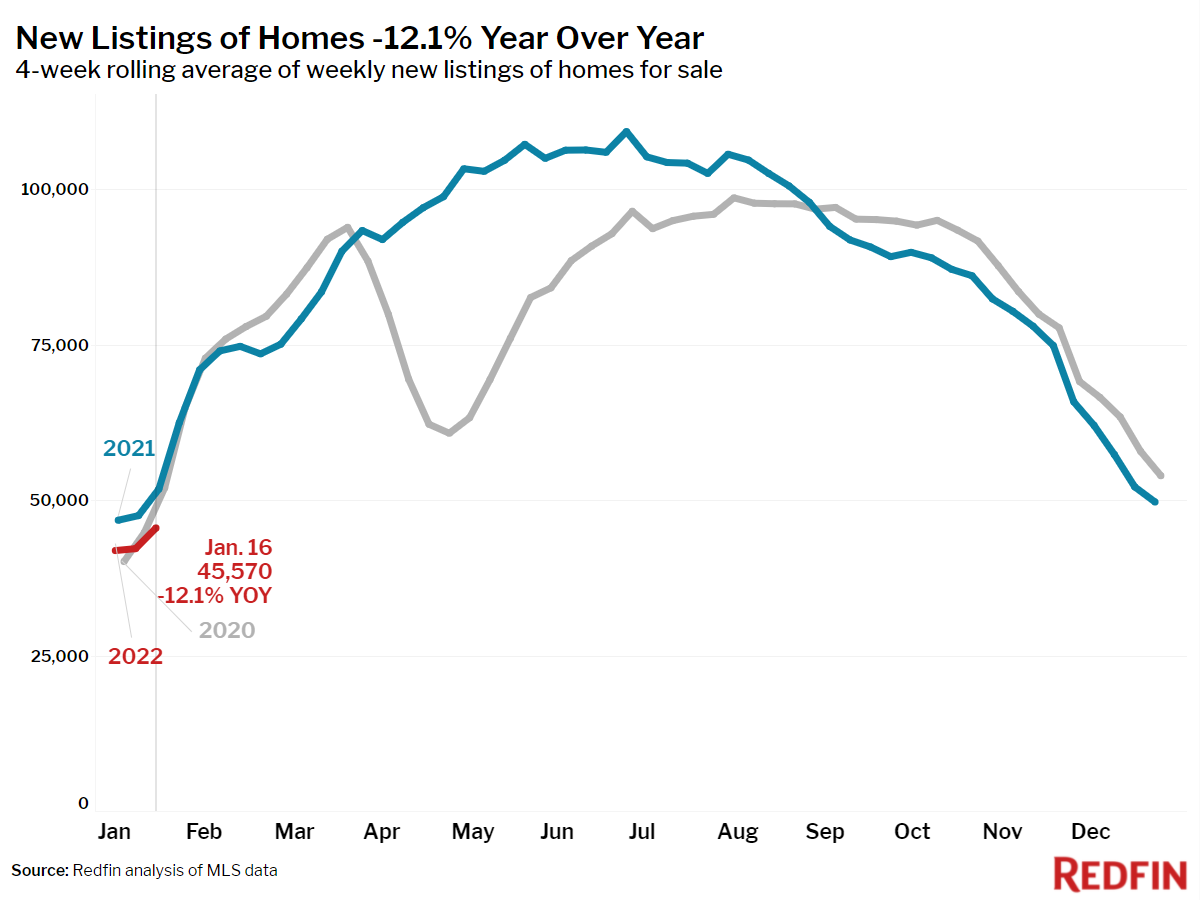
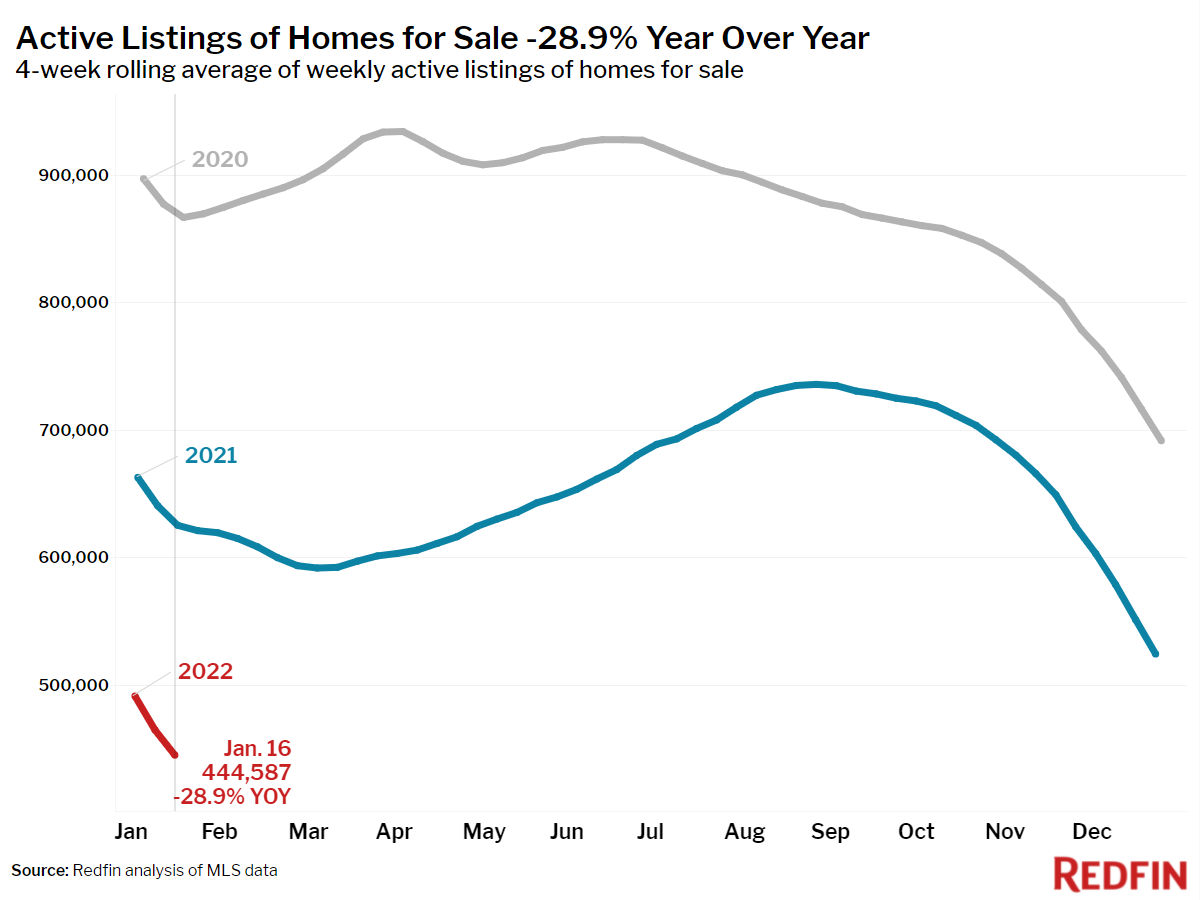
New listings fell 12% year over year, sending the total number of homes for sale down 29% to a new all-time low during the four weeks ending January 16. Constricted by supply, pending sales were up just 1%. One ray of hope for buyers is new construction—housing starts and building permits increased to a nine-month high in December.
“2022 started off more competitive than 2021, but mortgage rates have now risen enough that they may become more of a deterrent than a motivator for homebuyers,” said Redfin Chief Economist Daryl Fairweather. “In the next few weeks we may start to see signs that some buyers are backing off. This is the silver lining for the most committed homebuyers who may benefit from less intense competition in this supply-constrained market.”
“There is very little for sale right now, so nearly every new listing that’s priced fairly and is in good condition gets multiple offers,” said Chicago Redfin real estate agent Niko Voutsinas. “Labor and material shortages are limiting the supply of new construction, but also increasing buyers’ appetite for homes that are move-in ready. They don’t want to deal with any hassles of trying to find contractors to make improvements, so they’re willing to pay a premium for homes that don’t need any work.”
Key housing market takeaways for 400+ U.S. metro areas:
Unless otherwise noted, the data in this report covers the four-week period ending January 16. Redfin’s housing market data goes back through 2012.
Data based on homes listed and/or sold during the period:
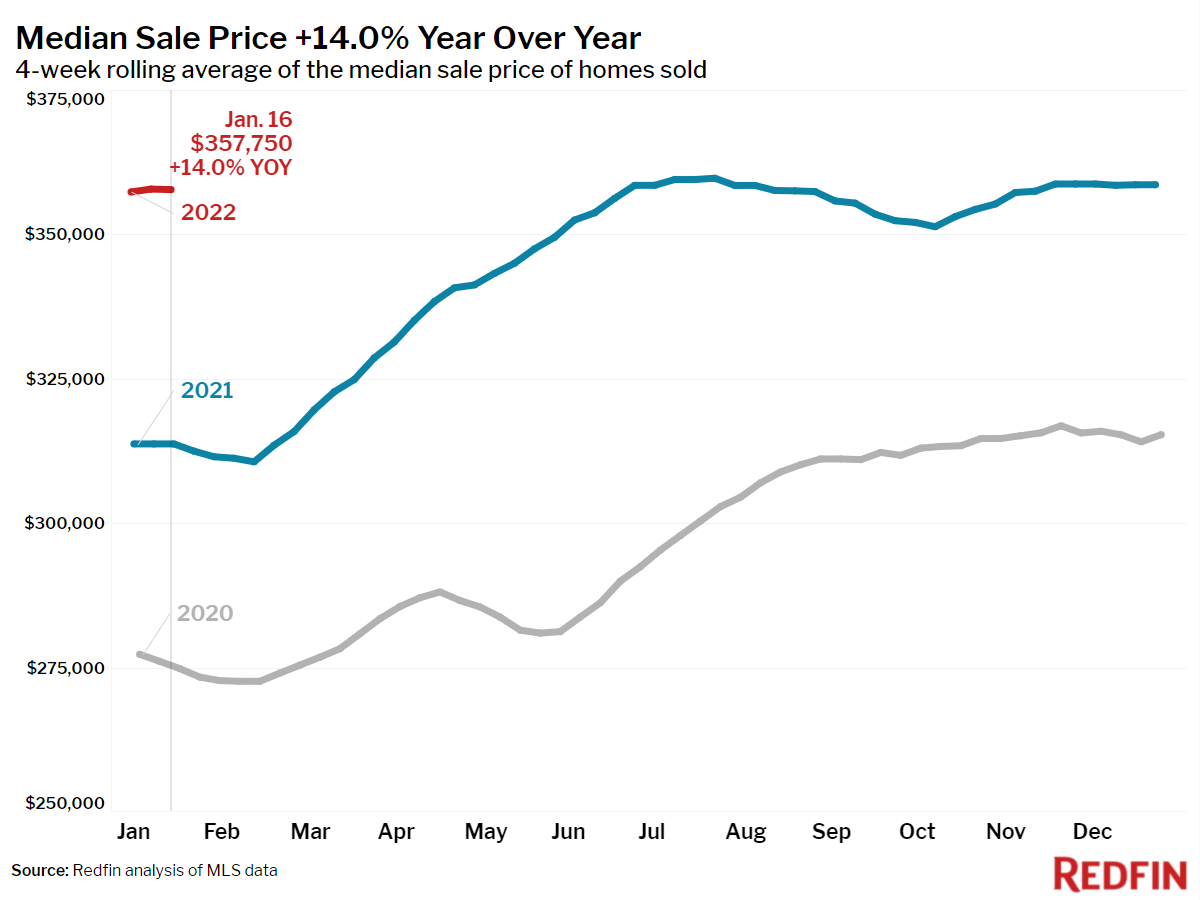
- The median home sale price was up 14% year over year to $358,500.
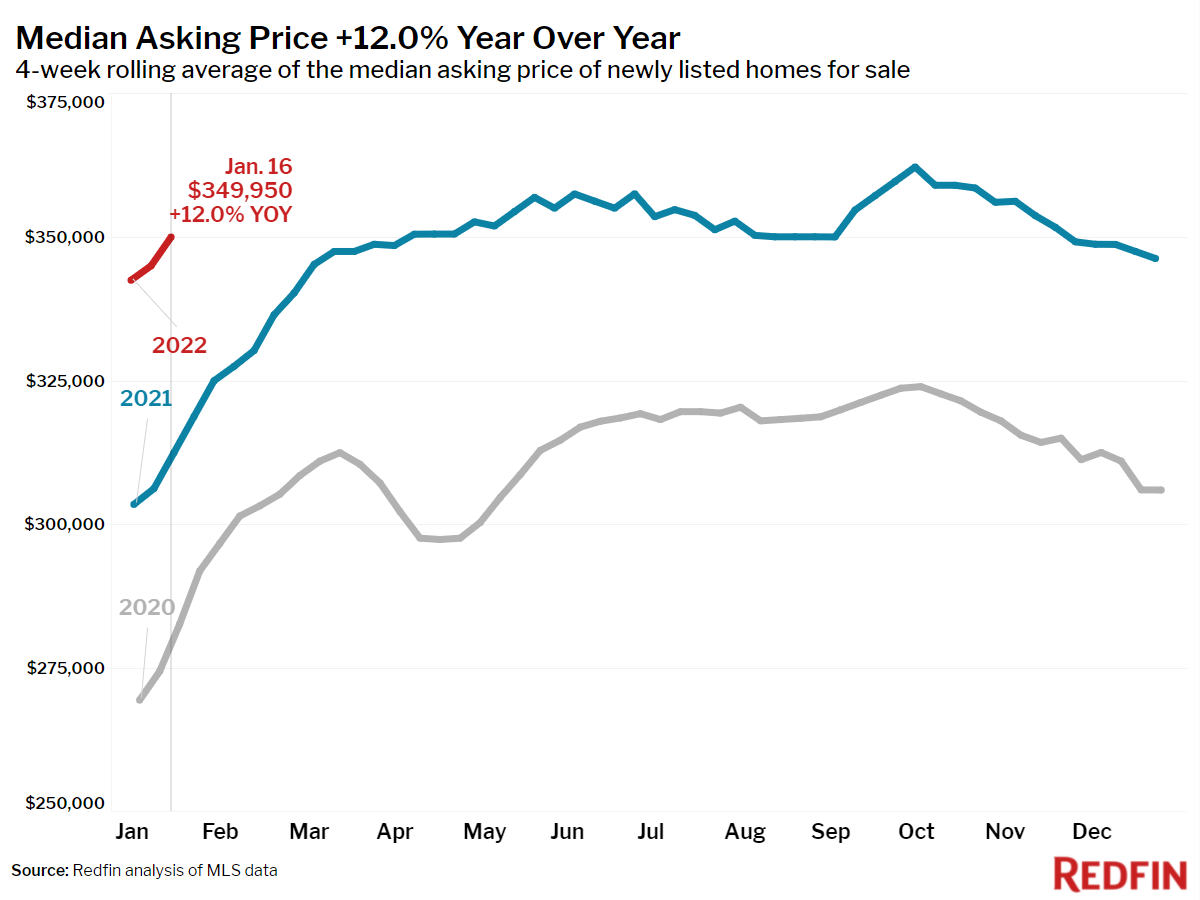
- The median asking price of newly listed homes increased 12% year over year to $349,950.
- Pending home sales were up 1% year over year.
- New listings of homes for sale were down 12% from a year earlier.
- Active listings (the number of homes listed for sale at any point during the period) fell 29% year over year, dropping to an all-time low of 445,000.
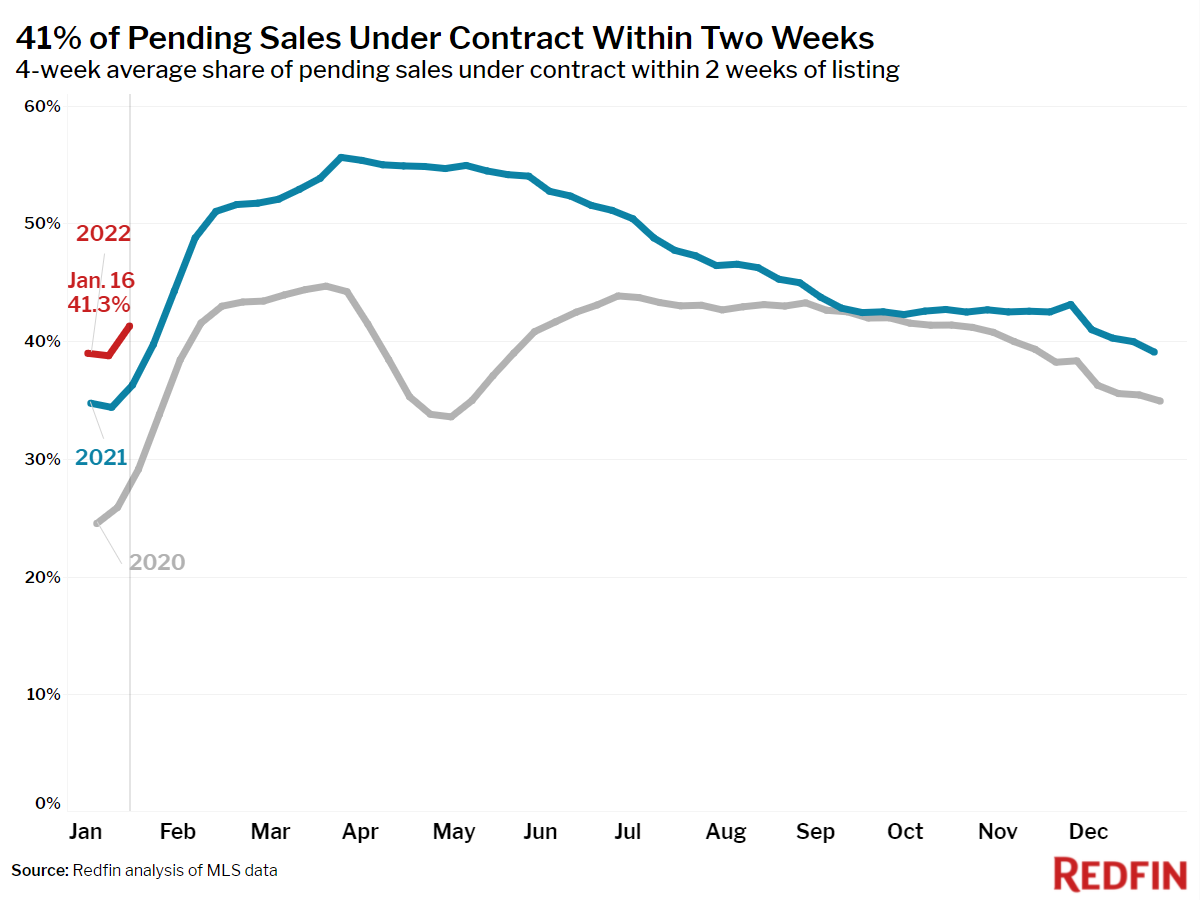
- The share of homes that went under contract that had an accepted offer within the first two weeks on the market was 41%, above the 36% rate of a year earlier.
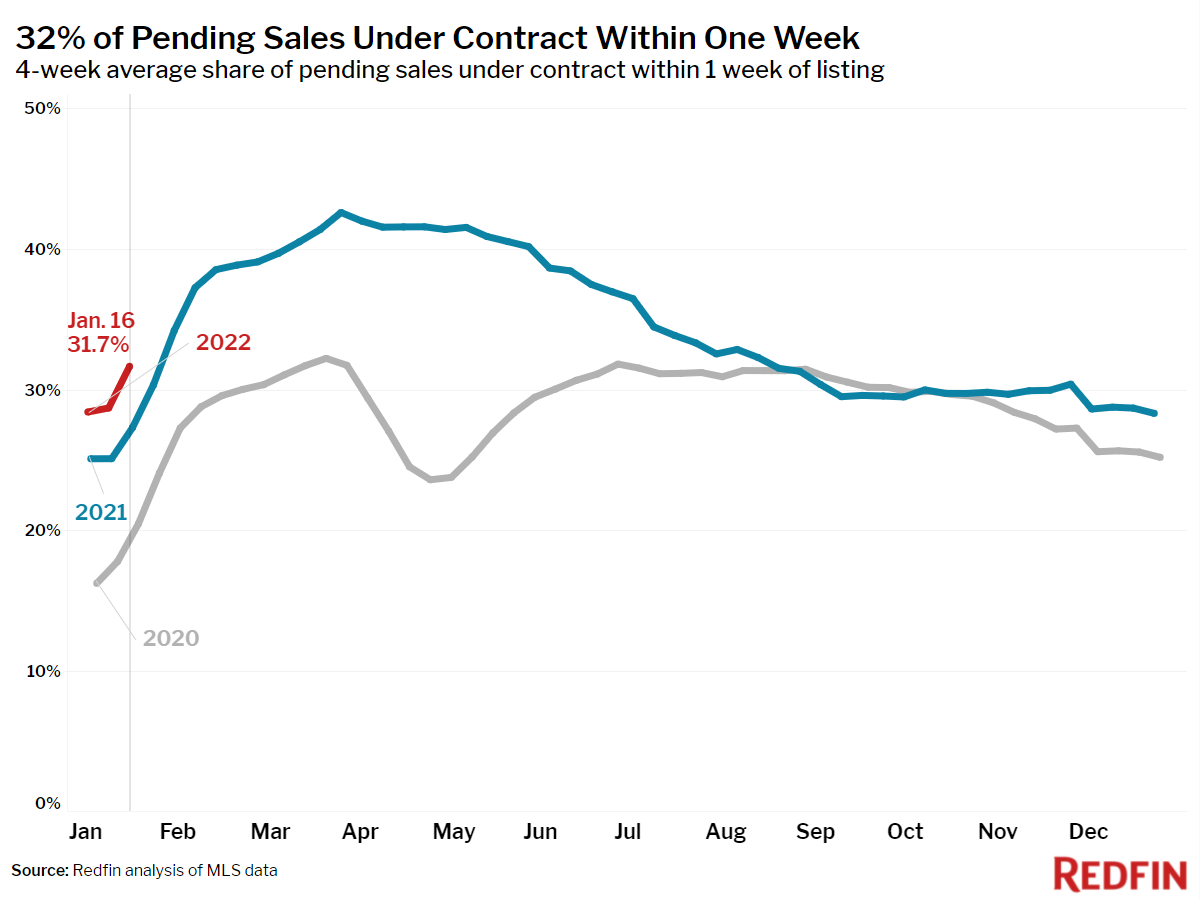
- 32% of homes that went under contract had an accepted offer within one week of hitting the market, up from 27% during the same period a year earlier.
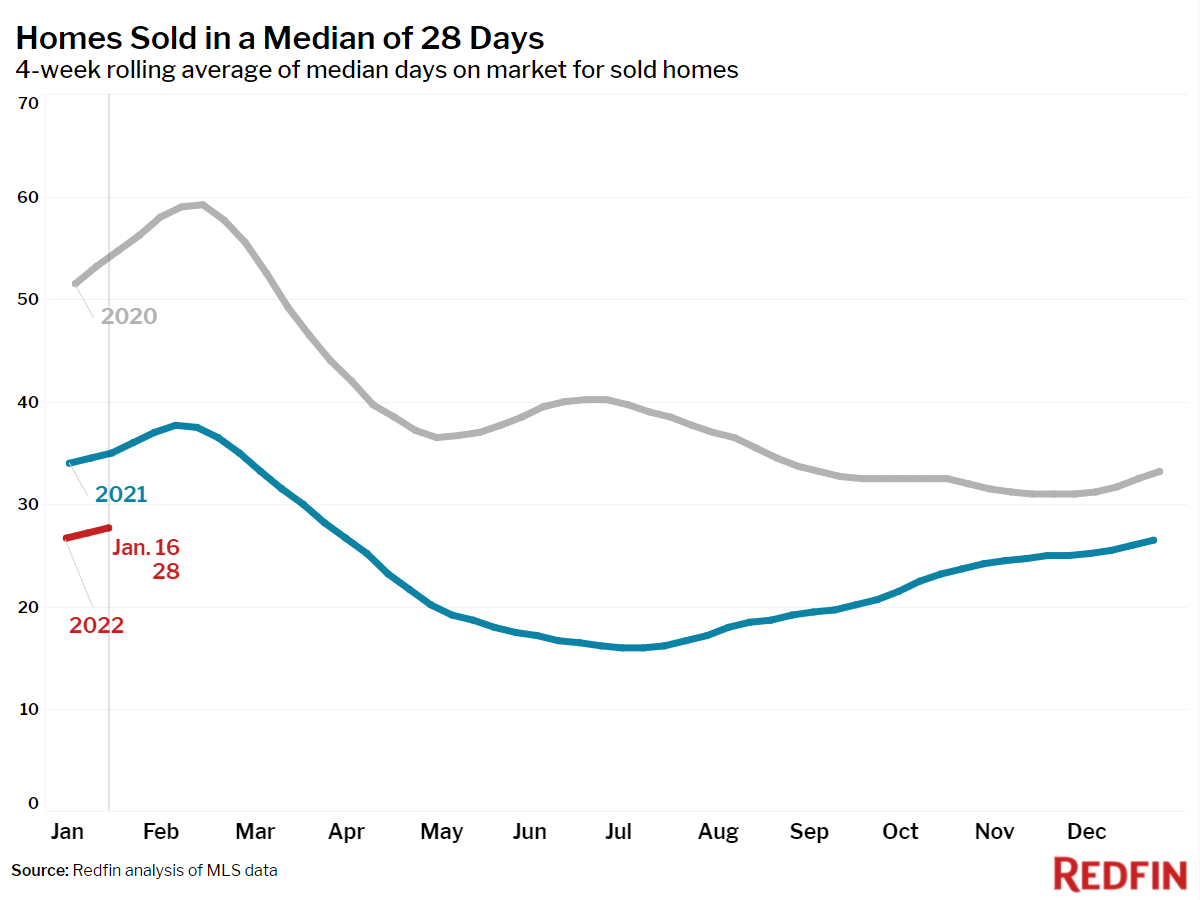
- Homes that sold were on the market for a median of 28 days, down from 35 days a year earlier.
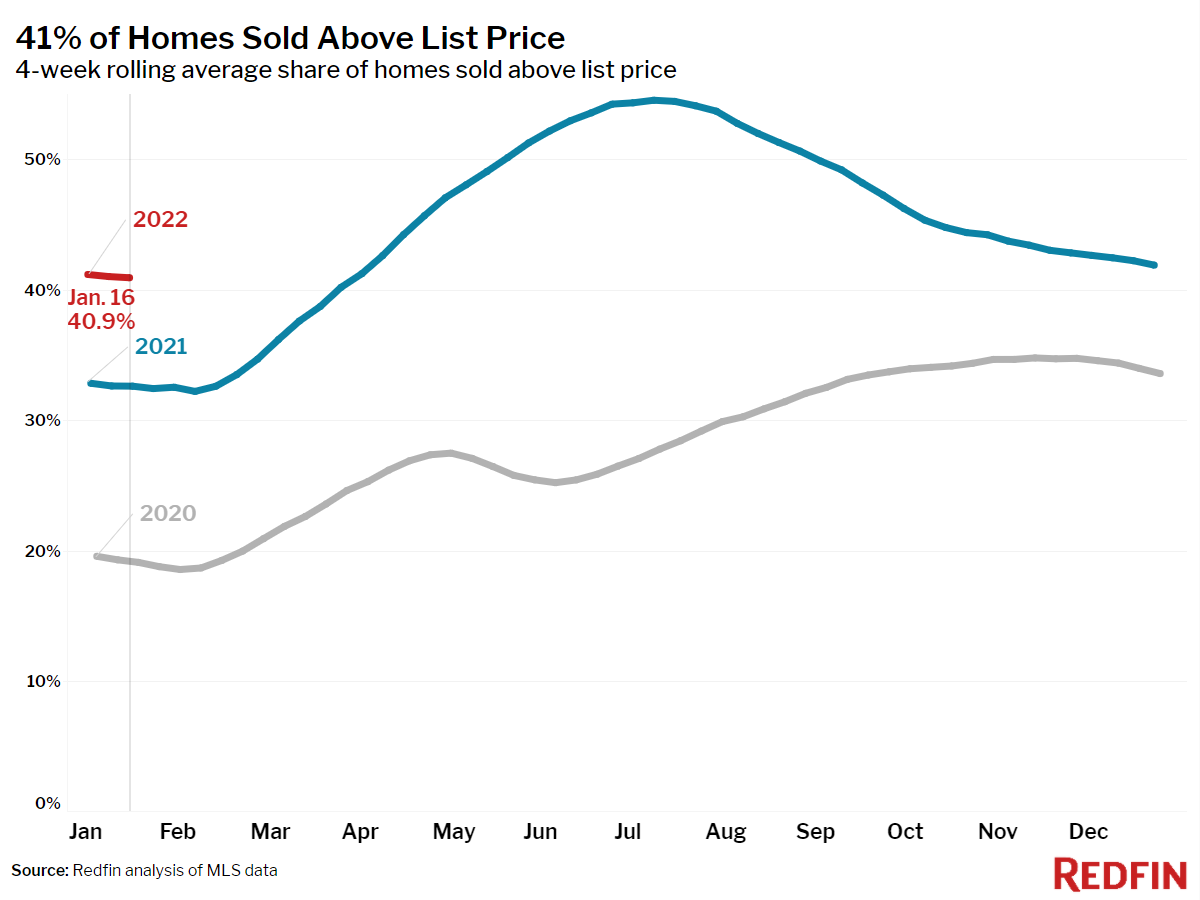
- 41% of homes sold above list price, up from 33% a year earlier.
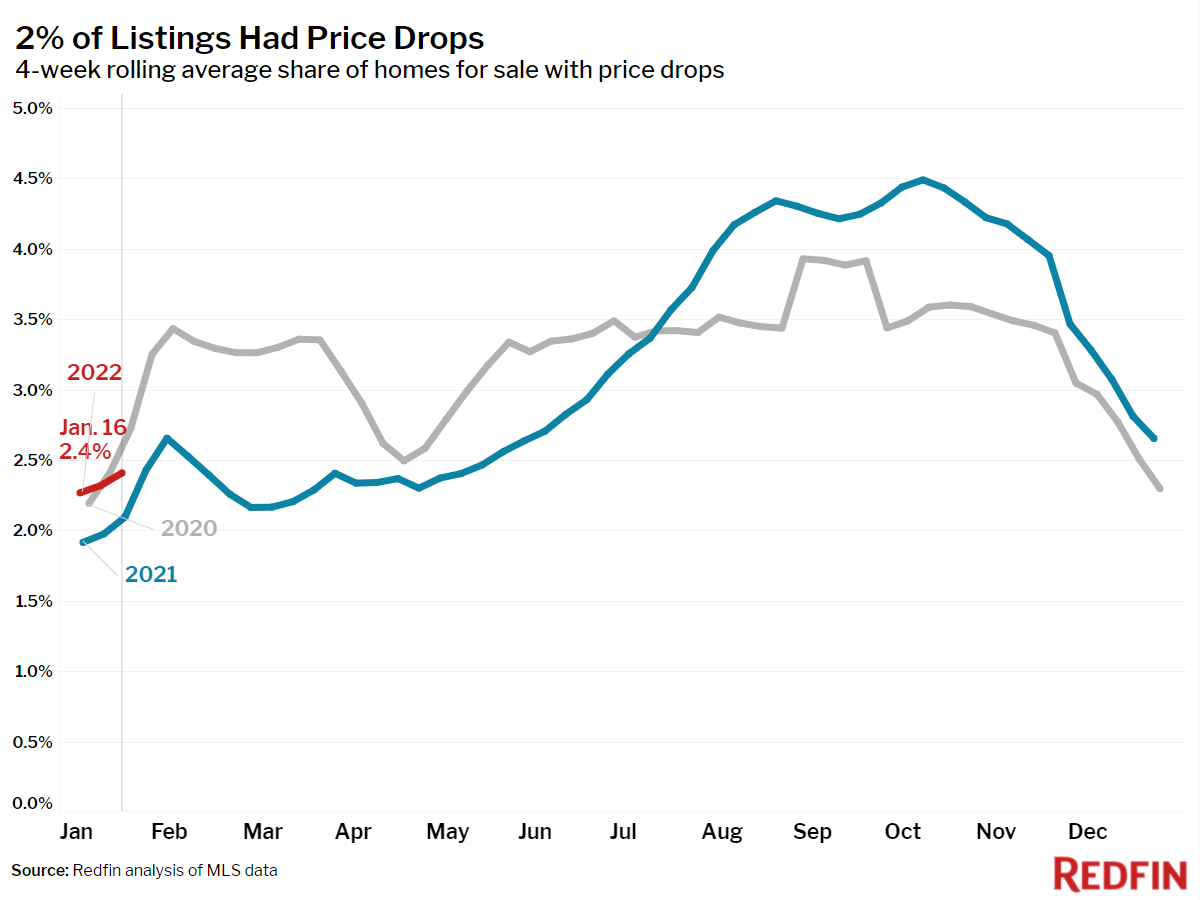
- On average, 2.4% of homes for sale each week had a price drop, up 0.3 percentage points from the same time in 2021.
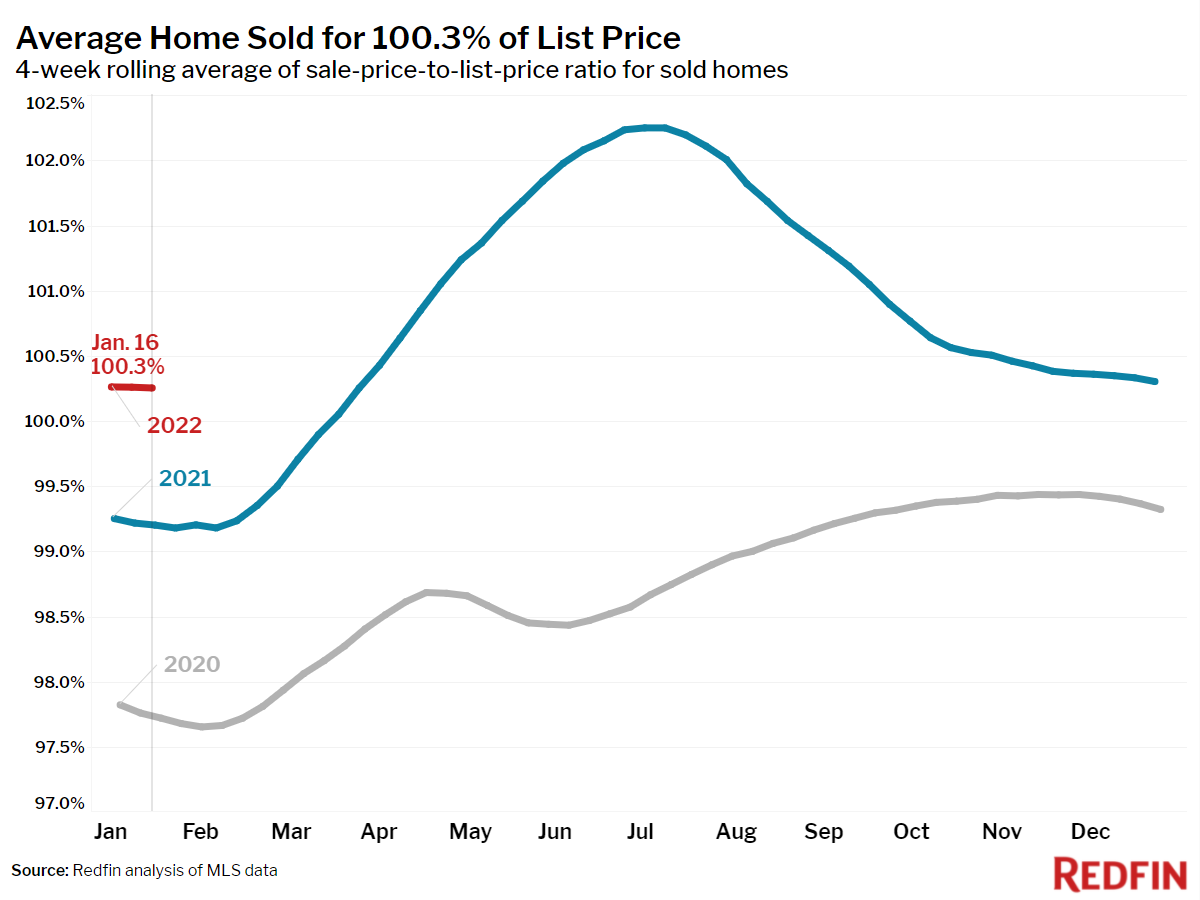
- The average sale-to-list price ratio, which measures how close homes are selling to their asking prices, was 100.3%. In other words, the average home sold for 0.3% above its asking price.
Other leading indicators of homebuying activity:
- Mortgage purchase applications increased 8% week over week (seasonally adjusted) during the week ending January 14. For the week ending January 20, 30-year mortgage rates rose to 3.56%, the highest level since March 2020.
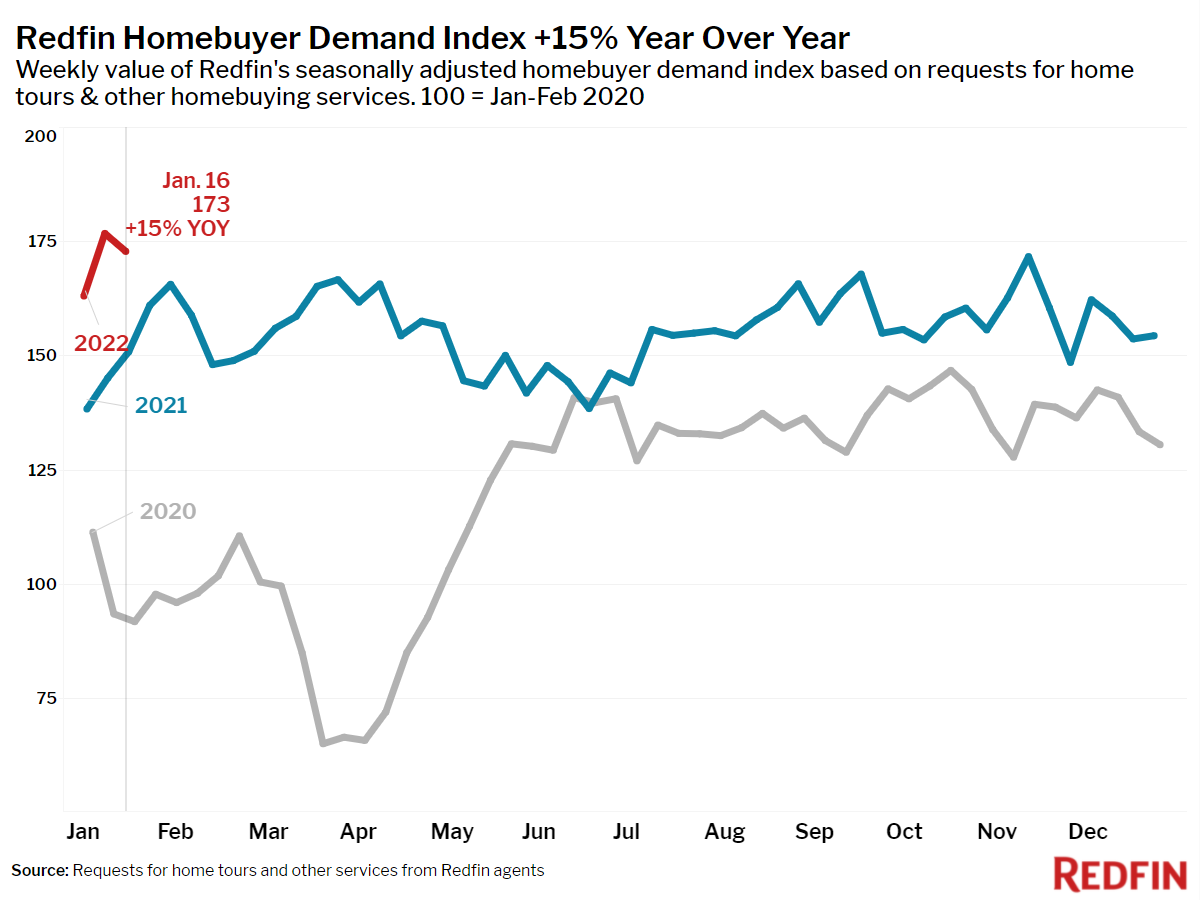
- The Redfin Homebuyer Demand Index fell 2% during the week ending January 16 and was up 15% from a year earlier. The seasonally adjusted Redfin Homebuyer Demand Index is a measure of requests for home tours and other home-buying services from Redfin agents.
Refer to our metrics definition page for explanations of all the metrics used in this report.


 United States
 Canada