Redfin’s 2018 Hottest Neighborhoods report shines light on a migration trend happening within the San Francisco Bay Area. We talk a lot about tech workers leaving Silicon Valley in search of affordability, but our Hottest Neighborhoods algorithm, which ranks neighborhoods based on increases in favorites and visits to home listings on Redfin.com, reveals that many aren’t going very far. Instead, they’re following tech companies like Google and Apple to downtown San Jose and nearby Sunnyvale and Cupertino. The increased demand has already begun to put pressure on San Jose’s housing market, which in December had the shortest supply, higher price growth (to a median home sale price of $1.1 million) and a faster pace of home sales than any other market. And now San Jose has another badge of housing-market honor to pin on its chest: nine of Redfin’s 10 Hottest Neighborhoods of 2018 are in the San Jose metro area.
“While the San Francisco peninsula has traditionally been the hottest of the hot places, we’re seeing it become unaffordable for even the tech giants that helped create its demand in the first place,” said Redfin Silicon Valley agent Kalena Masching. “The result has been a tech-worker migration to the South Bay charged by people looking for relative affordability, highly rated schools, short commutes and access to jobs.”
Read on for the 10 Hottest Neighborhoods, which all happen to be in the Bay Area, or scroll down for Redfin’s Hottest Neighborhoods Within Reach, which used a modified methodology to identify increasingly popular neighborhoods that are more affordable and as a result, more geographically diverse. We have also included the top three Hottest Neighborhoods for 49 metro areas at the bottom of the report.
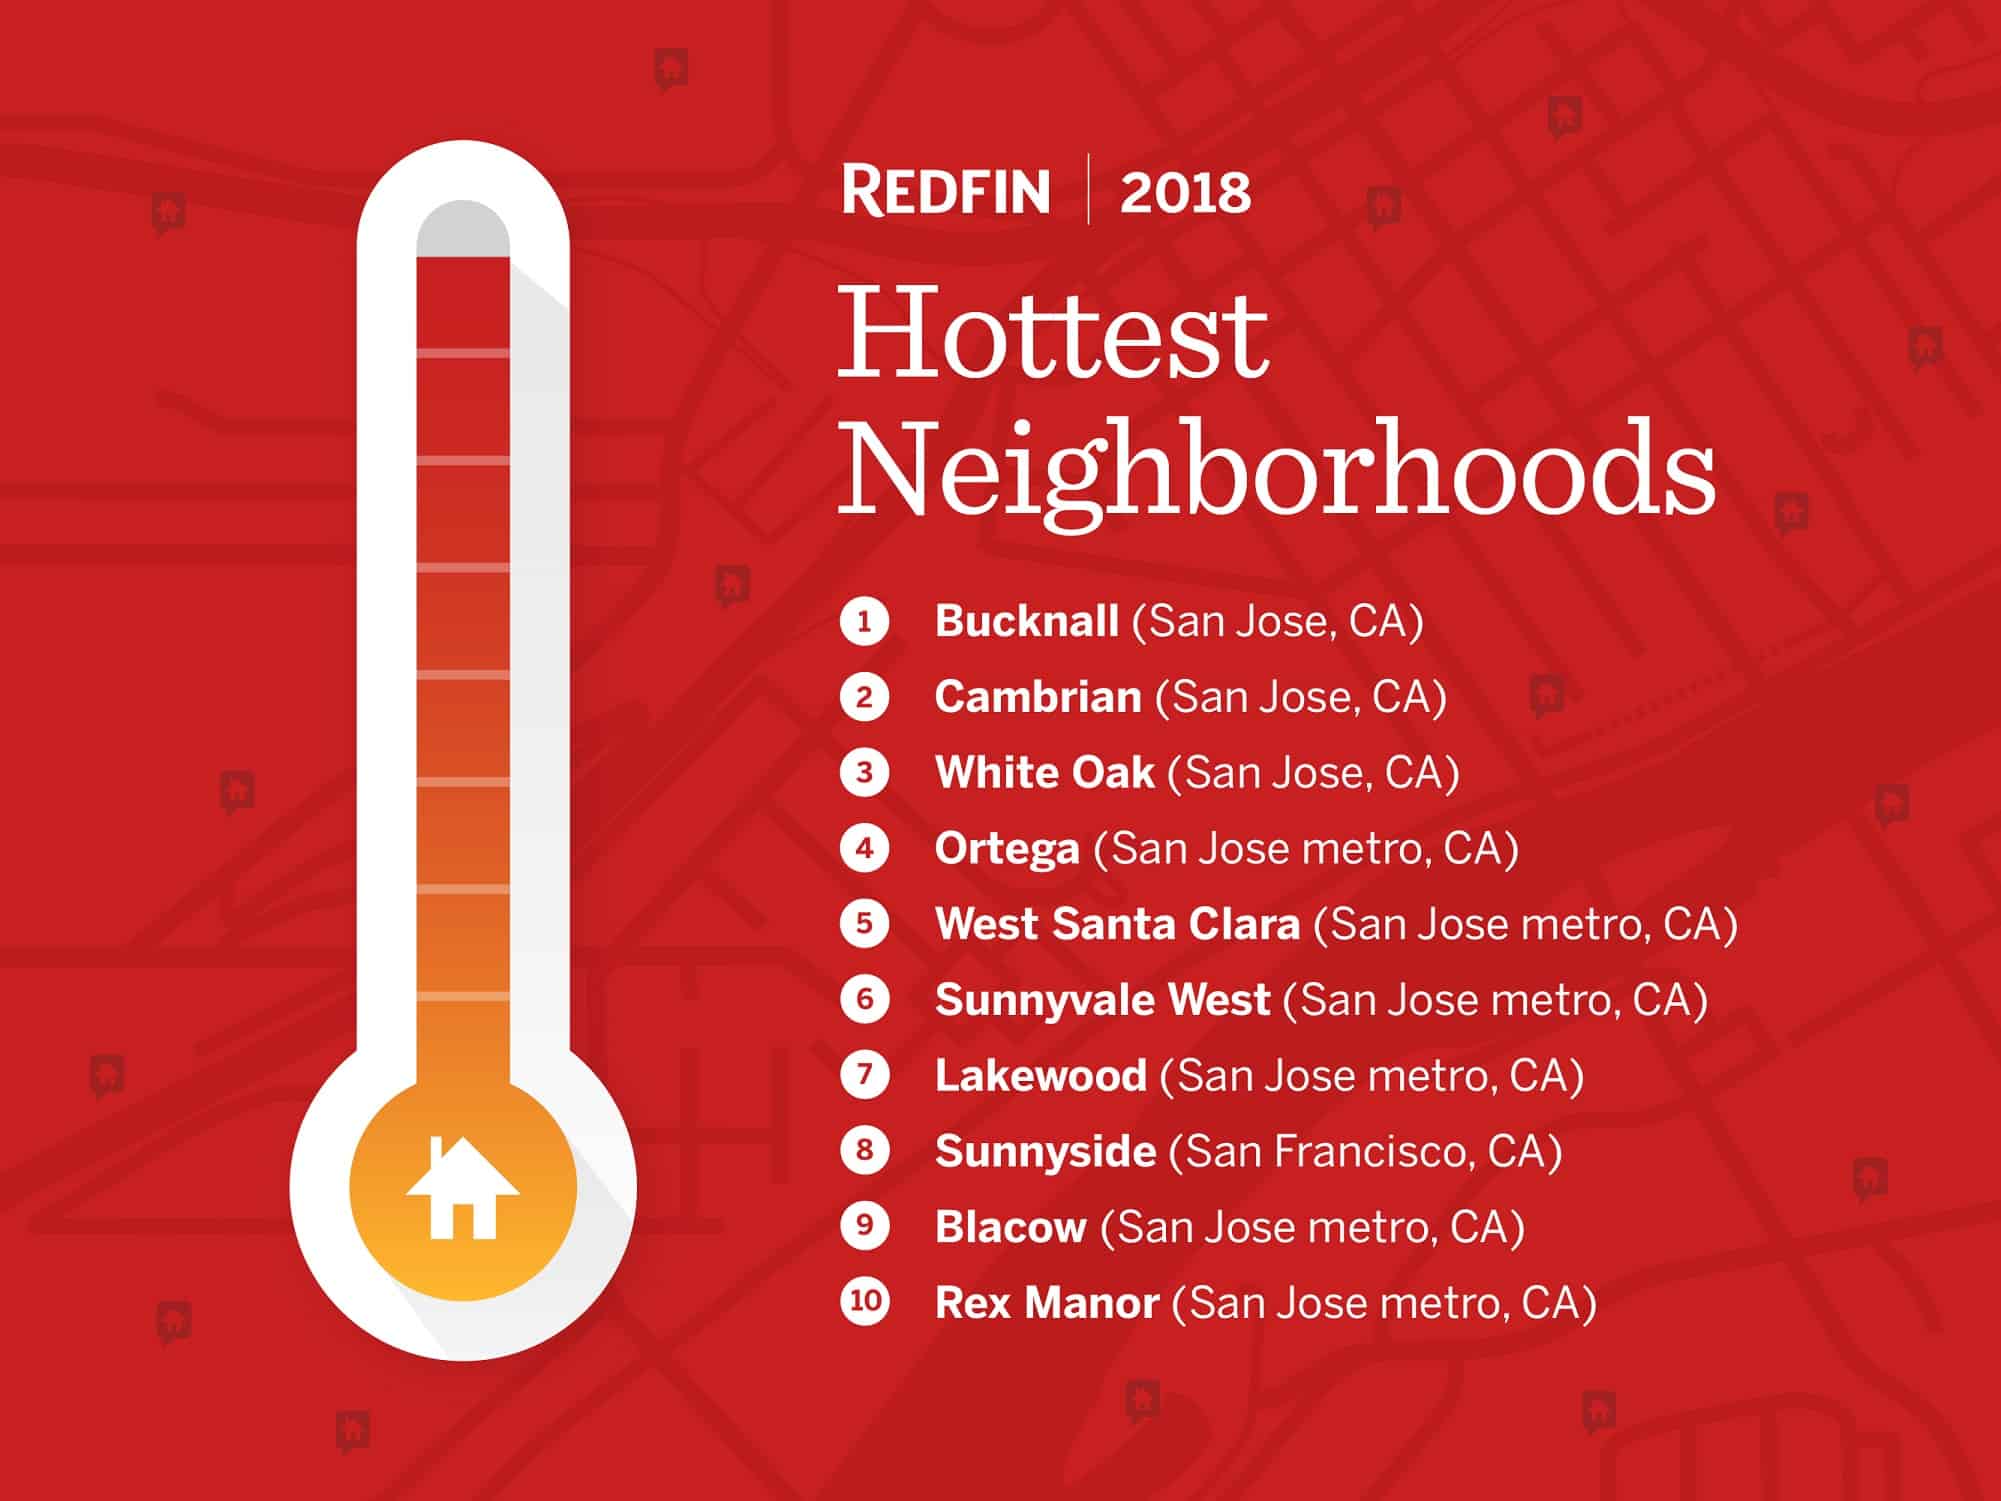
1. Bucknall, San Jose, CA
Median Sale Price (Dec. 2017): $1,565,000
Average Sale-to-List Price Ratio (Dec. 2017): 123.8%
Percent of Homes that Sold Above List Price (Dec. 2017): 100%
“Bucknall is hotter than ever; buyers should be prepared to act fast as the typical home goes off the market in just eight days,” said Redfin Silicon Valley agent Kalena Masching. “Bucknall has a ton of single-family homes, which sets it apart from many neighborhoods in the area that have more mixed-use or multi-family homes. Bucknall borders the Saratoga Westgate shopping plaza and has easy access to five grocery stores, multiple gyms and yoga studios, shopping, highly rated schools and a movie theater to help keep people entertained.”
2. Cambrian, San Jose, CA
Median Sale Price (Dec. 2017): $1,244,000
Average Sale-to-List Price Ratio (Dec. 2017): 118.0%
Percent of Homes that Sold Above List Price (Dec. 2017): 100%
“Homebuyers flock to Cambrian because of its easy access to public transit and the freeways, its proximity to downtown Campbell and the iconic Willow Glen and its highly rated schools,” said Redfin San Jose agent Kimberly Douglas. “Compared to other neighborhoods in San Jose, you get more home for your money. Locals enjoy evening farmers markets in the spring and fall, many public parks and greenspaces, and the nearby Camden community center, which offers lots of recreational activities for kids and adults.”
3. White Oak, San Jose, CA
Median Sale Price (Dec. 2017): $1,010,000
Average Sale-to-List Price Ratio (Dec. 2017): 105.7%
Percent of Homes that Sold Above List Price (Dec. 2017): 66.7%
“White Oak is a neighborhood that many first-time homebuyers choose because it has a lower price point and is close to vibrant Downtown Campbell and Downtown Los Gatos,” said Redfin San Jose agent Kimberly Douglas. “There are several highly rated schools in White Oak, and the Los Gatos Creek Trail is a popular spot for after-work hikes or a leisurely weekend stroll.”
4. Ortega, San Jose, CA
Median Sale Price (Dec. 2017): $1,920,000
Average Sale-to-List Price Ratio (Dec. 2017): 116.5%
Percent of Homes that Sold Above List Price (Dec. 2017): 100%
“Homebuyers like Ortega because of its proximity to the Cupertino and Santa Clara Apple campus, its highly rated schools and its access to highways 101 and 280,” said Redfin Silicon Valley agent Martin Garcia. “People also enjoy the abundance of grocery stores and unique, local restaurants, Ortega Park or the Community Center are popular places for residents to stretch their legs and get some exercise.”
5. West Santa Clara, San Jose, CA
Median Sale Price (Dec. 2017): $1,237,500
Average Sale-to-List Price Ratio (Dec. 2017): 116.1%
Percent of Homes that Sold Above List Price (Dec. 2017): 90.3%
“West Santa Clara has a lot of perks, and often times the people that seek it out travel a lot and appreciate the proximity to the San Jose Airport,” said Redfin Silicon Valley agent Martin Garcia. “It’s also really close to Koreatown, which has karaoke, incredible restaurants that infuse American and Korean flavors into fun dishes and grocery stores that sell unique-Korean ingredients.”
6. Sunnyvale West, San Jose, CA
Median Sale Price (Dec. 2017): $1,945,000
Average Sale-to-List Price Ratio (Dec. 2017): 118.3%
Percent of Homes that Sold Above List Price (Dec. 2017): 91.3%
“Sunnyvale West has historic, century-old homes intertwined with new construction, giving the neighborhood a real old-meets-new feel that you can’t really find anywhere else in San Jose,” said Redfin Silicon Valley agent Chad Eng. “People like the neighborhood because of its proximity to the Caltrain station and downtown Sunnyvale, which has really been revitalized in recent years. There are lots of community events in the summer, like concerts and movies in the streets, farmers markets and jazz bands that play along the sidewalk.”
7. Lakewood, San Jose, CA
Median Sale Price (Dec. 2017): $1,200,000
Average Sale-to-List Price Ratio (Dec. 2017): 121.3%
Percent of Homes that Sold Above List Price (Dec. 2017): 92.3%
“Lakewood is a good commuter neighborhood and one of the few remaining places in the San Jose metro area where people can get a home for less than $1 million without getting deep into San Jose or going to the East Bay,” said Redfin Silicon Valley agent Jason Burkhart. “It’s close to Mission College and a fairly new shopping plaza with a beautiful movie theater, small grocery store and plenty of restaurants and pubs to keep up with demand. The neighborhood is also close to the new 49ers stadium and California’s Great America, which some people love but others see as a nuisance because of the added traffic and noise.”
8. Sunnyside, San Francisco, CA
Median Sale Price (Dec. 2017): $1,272,500
Average Sale-to-List Price Ratio (Dec. 2017): 125.0%
Percent of Homes that Sold Above List Price (Dec. 2017): 89.5%
“Sunnyside is a popular spot because it’s a bit more affordable than Glen Park, but still has easy access to 280 and Bay Area Rapid Transit (BART),” said Redfin San Francisco agent Miriam Westberg. “In recent months, homes Redfin listed in the neighborhood went under contract in as little as two days because there were so many well-qualified buyers ready to pounce on this desirable location.”
9. Blacow, San Jose, CA
Median Sale Price (Dec. 2017): $1,005,000
Average Sale-to-List Price Ratio (Dec. 2017): 109.4%
Percent of Homes that Sold Above List Price (Dec. 2017): 91.7%
“Blacow is a neighborhood in Fremont that is known for its relative affordability and schools in the areas that rankings have been increasing,” said Redfin Fremont agent Kat Said. “People also really enjoy the new construction homes in the area and all the nearby places to shop. One hot spot is NewPark Mall, which has some of the best restaurants in town and is a short car ride away from most homes in Blacow.”
10. Rex Manor, San Jose, CA
Median Sale Price (Dec. 2017): $1,500,000
Average Sale-to-List Price Ratio (Dec. 2017): 114.4%
Percent of Homes that Sold Above List Price (Dec. 2017): 83.9%
“Rex Manor has been gaining traction as a desirable neighborhood, where you’ll see many residents riding their bikes to Google, Shoreline Park and the Shoreline Amphitheatre, where people can enjoy all sorts of live music and events,” said Redfin San Jose agent Kalena Masching. “The area still has some relatively affordable homes, and we’re seeing a lot of attention from the investment community where people come in and buy up the older homes under 1,400 square feet and turn them into modern, technology-filled homes that sell like hotcakes.”
2018’s Hottest Neighborhoods Within Reach
While well-established tech cities continue to become more and more expensive, we expect to see many more large companies build additional headquarters in new cities—like we’ve seen with Amazon and most recently Apple. That got us thinking, if tech companies are chasing talent and talent is chasing affordability, what hot places are there that don’t come with a hefty price tag like we see in the Bay Area? We decided to compile a second list of Hottest Neighborhoods with a price cap at $286,700, which was the national median sale price in December 2017.
The result was a more geographically diverse set of neighborhoods. People looking for more affordable homes in Washington D.C. and Seattle can turn to neighborhoods like Hillcrest, Deanwood and Riverview, which have less expensive homes but also plenty of greenspace and access to job centers. Our “Within Reach” ranking also surfaced several neighborhoods across the Midwest, with hot hoods in Columbus, Chicago, Milwaukee, Minneapolis and St. Louis cracking the top 10.
Another trend we noticed with this list is that homebuyers are not sacrificing livability for the sake of affordability.
“The Hottest Neighborhoods within reach list has places chock-full of amenities and diverse housing types,” said Redfin chief economist Nela Richardson. “Features like easy commutes, farmer’s markets and proximity to parks or the beach all represent livability characteristics that many people value when searching for homes. Also, these areas have a mix of single family homes, condos and townhouses, which make the neighborhoods accessible to a wide range of incomes.”
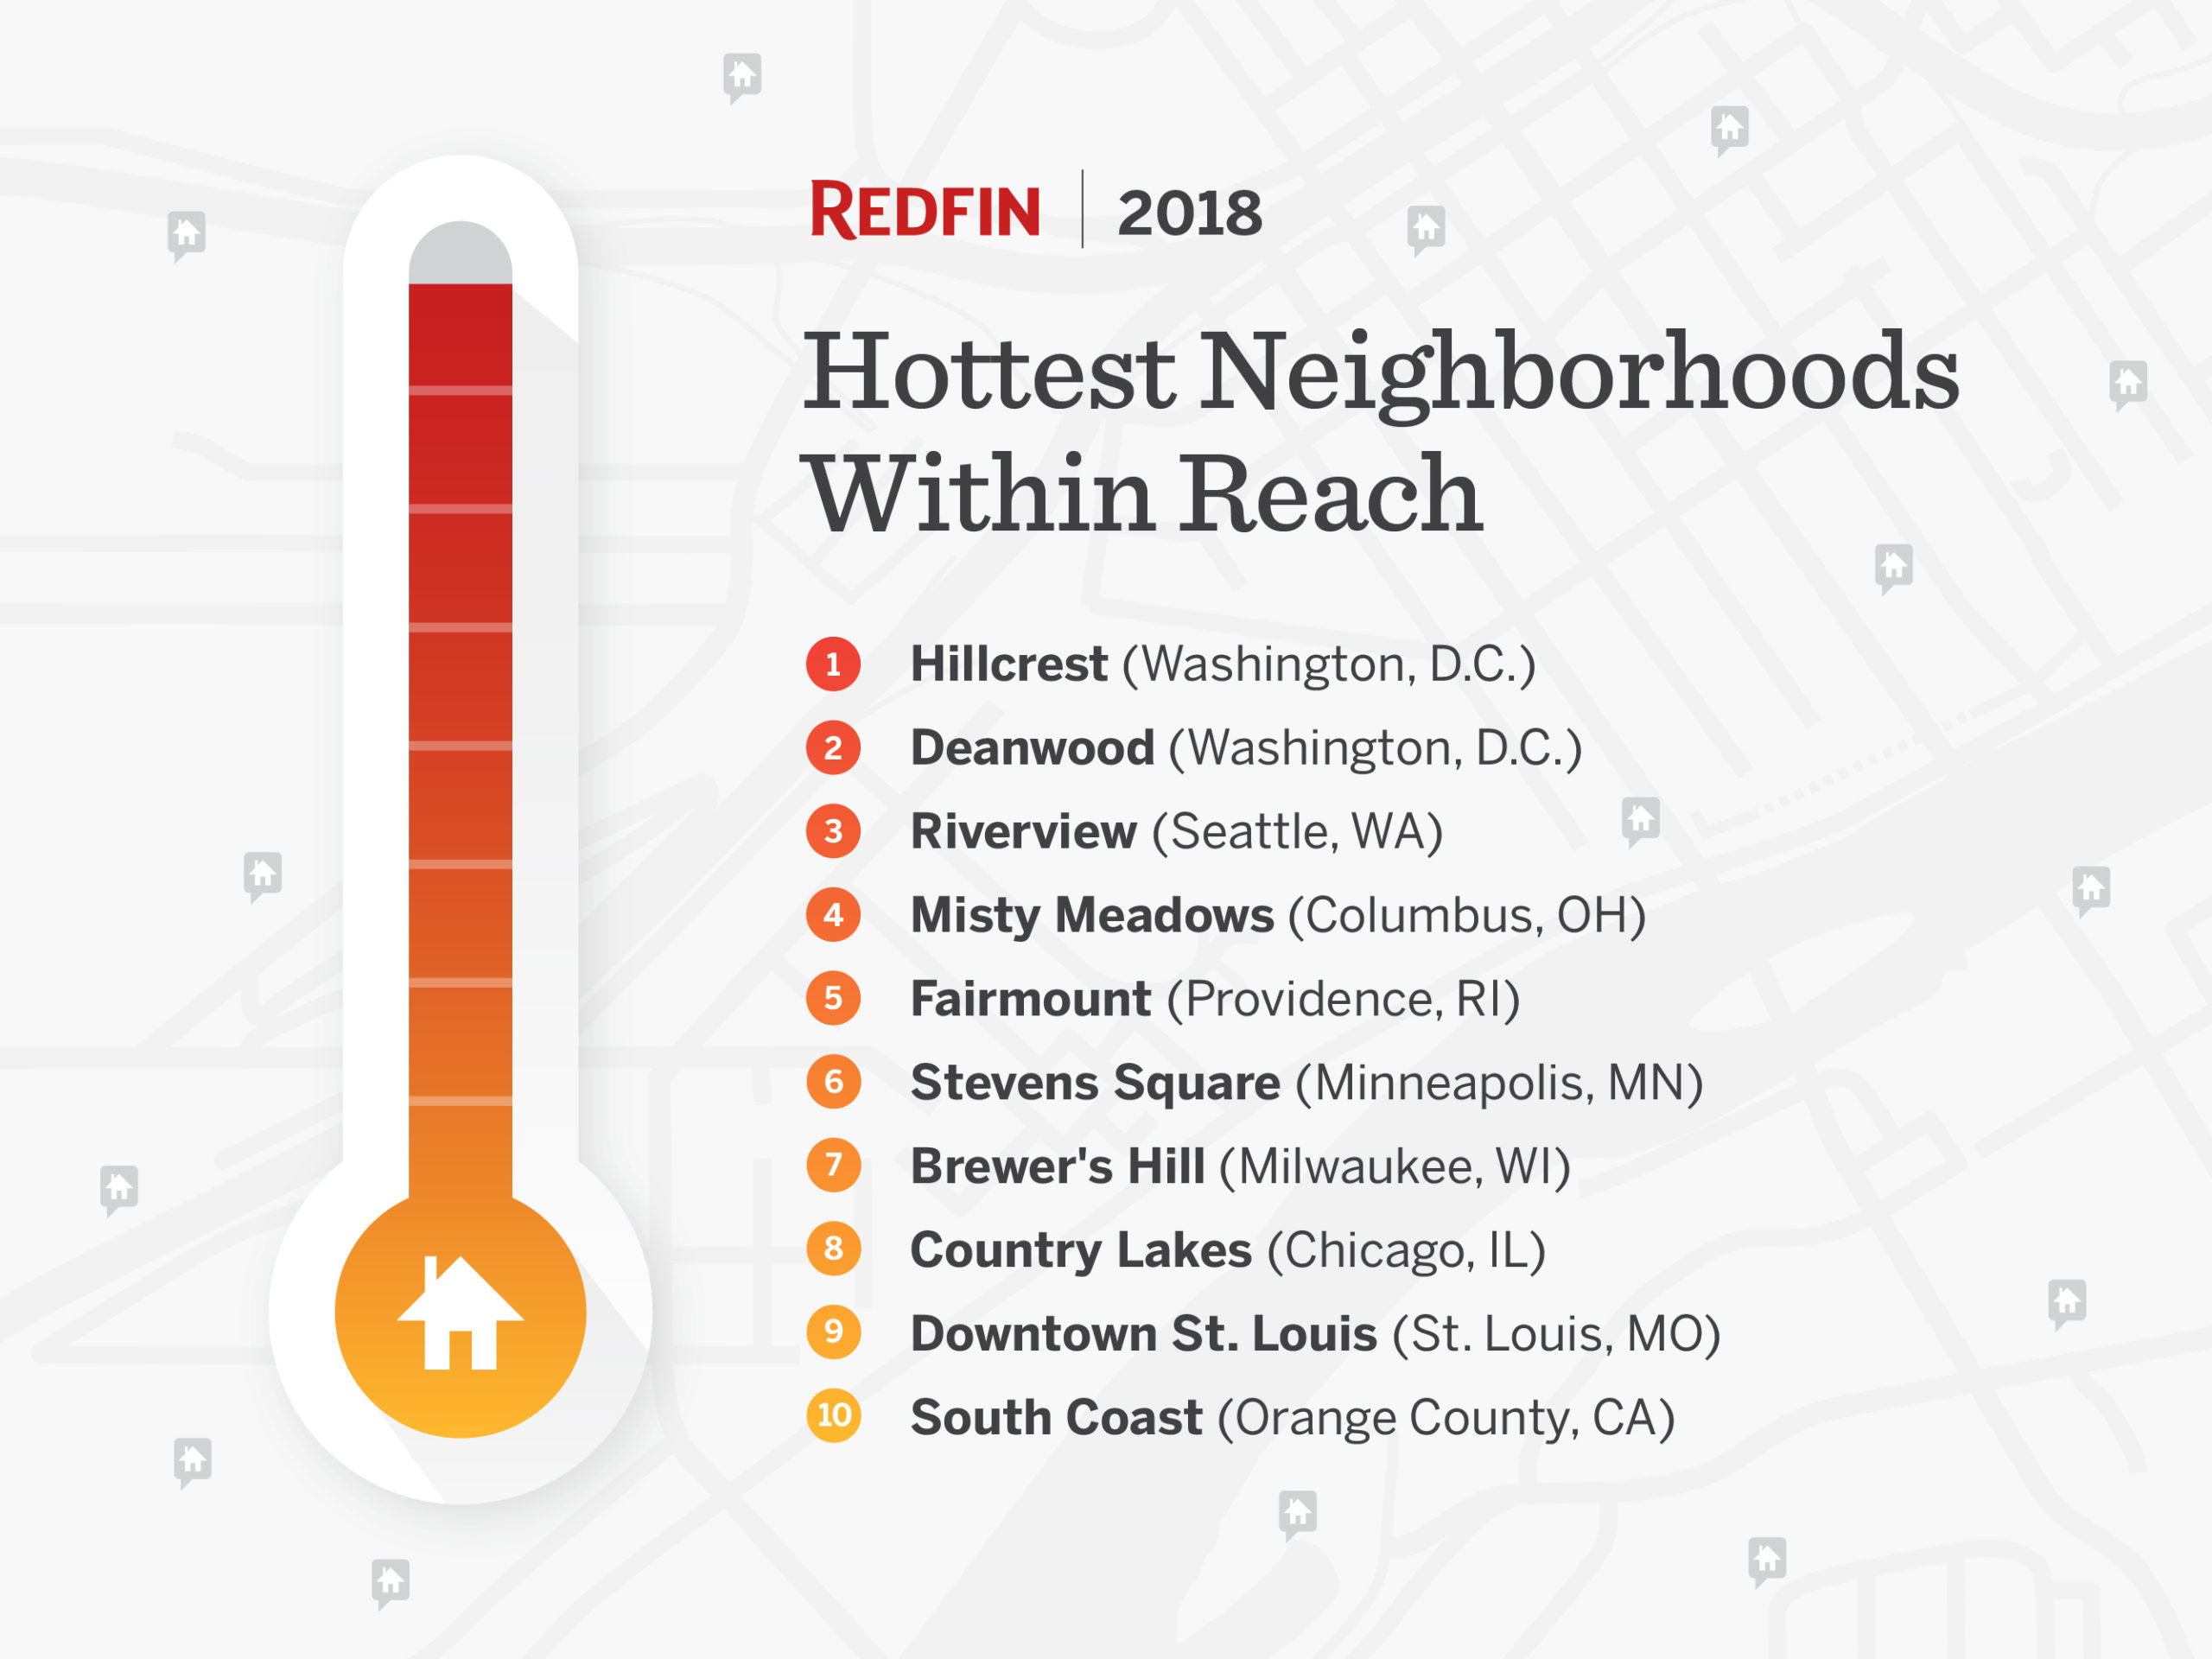
1. Hillcrest, Washington D.C.
Median Sale Price (Dec. 2017): $125,000
Average Sale-to-List Price Ratio (Dec. 2017): 96.8%
Percent of Homes that Sold Above List Price (Dec. 2017): 25.0%
“I just helped a family purchase a pre-war home in Hillcrest with plenty of original charm and space to grow,” said Redfin D.C. agent Will Hirzy. “Hillcrest is one of the only neighborhoods in the city that offers single-family homes on decent-sized lots for an affordable price. Buyers are drawn to this leafy, residential corner of the city because it’s affordable, while still convenient to Capitol Hill, Navy Yard and Downtown.”
2. Deanwood, Washington D.C.
Median Sale Price (Dec. 2017): $248,500
Average Sale-to-List Price Ratio (Dec. 2017): 100.5%
Percent of Homes that Sold Above List Price (Dec. 2017): 50.0%
“Deanwood and many of the neighborhoods east of the Anacostia River are seeing increasing homebuyer and investor interest,” said Redfin D.C. agent Rory Obletz. “The area has homes to suit everyone, including townhomes, single-family homes and some condos. Affordability is a huge draw for buyers who are amazed at how much more space they can afford in Deanwood than in other parts of the city. Deanwood has a metro station that makes commuting downtown a breeze and new developments are making this area more walkable.”
3. Riverview, Seattle, WA
Median Sale Price (Dec. 2017): $270,000
Average Sale-to-List Price Ratio (Dec. 2017): 100.7%
Percent of Homes that Sold Above List Price (Dec. 2017): 54.6%
“Riverview is one of the more affordable options in Seattle that has easy access to I-5 and Highway 99,” said Redfin Seattle agent Thomas Hobbs Jr. “Being that it’s a bit outside of the city, it has lots of beautiful green space nearby. Grandview Off-Leash Dog Park covers 34 acres and is a fantastic place for people to walk their dogs, and Russell Woods Park and Riverfront Park are both also a quick drive away.”
4. Misty Meadows, Columbus, OH
Median Sale Price (Dec. 2017): $161,500
Average Sale-to-List Price Ratio (Dec. 2017): 99.3%
Percent of Homes that Sold Above List Price (Dec. 2017): 20.0%
“Misty Meadows is a small suburban community in Columbus with an 80s vibe, made up of mostly one- and two-story single family homes,” said Redfin Columbus agent Joseph Wahlsmith. “People like Misty Meadows because it is easy to get to, affordable, there are plenty of restaurants and shopping nearby and it is located in the Dublin City School District. Nearby is the Ohio State University’s Don Scott airport (named after famous WWII Hero and local football star) where people go for lunch and then visit the small watchtower to view small planes taking off and landing. Carriage Place Park where people gather for picnics, to play tennis and enjoy the outdoors, is also nearby.”
5. Fairmount, Providence, RI
Median Sale Price (Dec. 2017): $170,000
Average Sale-to-List Price Ratio (Dec. 2017): 98.2%
Percent of Homes that Sold Above List Price (Dec. 2017): 30.8%
“Fairmount is a neighborhood in Woonsocket, which is a town north of Providence, near the border of Rhode Island and Massachusetts,” said Redfin Providence agent Shelly D’Amico. “Woonsocket buyers have their choice of home styles as the area offers new construction, trendy urban loft properties in renovated mill buildings and classic New England colonial homes as well. Woonsocket offers more affordable homes than Providence. Likewise, people who work in Boston are increasingly coming south to Rhode Island towns in search of affordability.”
6. Stevens Square, Minneapolis, MN
Median Sale Price (Dec. 2017): $116,000
Average Sale-to-List Price Ratio (Dec. 2017): 98.5%
Percent of Homes that Sold Above List Price (Dec. 2017): 33.3%
“Stevens Square is heating up now because it’s affordable and near Central Minneapolis, which is an area that has been off the charts on fire for awhile now,” said Redfin Minneapolis agent Chris Prescott. “Stevens Square gives homebuyers an avenue for cheaper downtown living, because it’s just across the freeway from the Convention Center and other amenities located in the heart of Minneapolis.”
7. Brewer’s Hill, Milwaukee, WI
Median Sale Price (Dec. 2017): $260,000
Average Sale-to-List Price Ratio (Dec. 2017): 97.4%
Percent of Homes that Sold Above List Price (Dec. 2017): 22.2%
“People love the homes in Brewer’s Hill because they have a lot of old-world charm and character for a lower price than you’d find in other nearby neighborhoods,” said Redfin Milwaukee agent Ashley Lamb. “This is also a spot with lots of up-and-coming restaurants, shops and boutiques nearby, which is a huge perk for homeowners in the area.”
8. Country Lakes, Chicago, IL
Median Sale Price (Dec. 2017): $207,250
Average Sale-to-List Price Ratio (Dec. 2017): 97.3%
Percent of Homes that Sold Above List Price (Dec. 2017): 0%
“Country Lakes has really continued its momentum from last year, when Redfin named it the ninth hottest neighborhood in the country,” said Redfin Chicago agent Michael Rothe. “We’re still seeing new homes being built because most lots are within a mile from the train, and there are so many paths to get to transit easily and peacefully. Other perks include highly rated schools, easy access to I-88 and affordable homes.”
9. Downtown St. Louis, St. Louis, MO
Median Sale Price (Dec. 2017): $139,900
Average Sale-to-List Price Ratio (Dec. 2017): 95.9%
Percent of Homes that Sold Above List Price (Dec. 2017): 4.4%
“Downtown St. Louis provides the best of cool and chic loft living,” said Redfin St. Louis agent Tamika Evans. “Many of the residential and commercial lofts in Downtown St.Louis boast unusually flexible layouts with architectural perks that provide classic, relaxed and sophisticated living spaces. Downtown has a high Walk Score of 89 and is home to myriad cultural, dining and entertainment venues.”
10. South Coast, Orange County, CA
Median Sale Price: $277,000
Average Sale-to-List Price Ratio: 99.9%
Percent of Homes that Sold Above List Price: 40.7%
“South Coast’s convenient proximity to both Interstate 405 and State Route 55 make getting to Irvine and Santa Ana a breeze,” said Redfin Orange County agent Marc Raine. “If you’re a frequent traveler, John Wayne Airport is just a 10-minute drive, and you can often make it to Newport Beach in under 20 minutes. There’s always lots to do in the area, with the South Coast Plaza offering great shopping nearby, plus highly rated Mexican, Japanese and seasonal American fare just minutes away. South Coast is a great, affordable alternative to neighborhoods in Irvine.”
What Makes a Neighborhood Hot
Redfin’s Hottest Neighborhoods is a prediction based on the most recent growth we’ve seen in page views and favorites on Redfin.com. We checked in with Redfin agents around the country to find out what’s been driving these trends.
For more downloadable housing market stats, visit the Redfin Data Center.
The Hottest Neighborhoods of 2018 by Metropolitan Area
In addition to the top 10 Hottest Neighborhoods nationwide and Hottest Neighborhoods Within Reach, we picked three neighborhoods in each of the largest metro areas that are poised to become some of the most desirable places in 2018. Use the links below to jump to a market, or scroll down through the whole list. All data is from December 2017.
Atlanta, GA | Austin, TX | Bakersfield, CA | Baltimore, MD | Boston, MA | Buffalo, NY | Charlotte, NC | Chicago, IL | Cincinnati, OH | Cleveland, OH | Colorado Springs, CO | Columbus, OH | Dallas-Fort Worth, TX | Denver, CO | Detroit, MI | Fort Lauderdale, FL | Hampton Roads, VA | Houston, TX | Jacksonville, FL | Kansas City, MO | Las Vegas, NV | Los Angeles, CA | Memphis, TN | Miami, FL | Milwaukee, WI | Minneapolis-St. Paul, MN | New Orleans, LA | Oakland, CA | Orange County, CA | Orlando, FL | Philadelphia, PA | Phoenix, AZ | Pittsburgh, PA | Portland, OR | Providence, RI | Queens, NY | Riverside-San Bernardino, CA | Sacramento, CA | San Antonio, TX | San Diego, CA | San Francisco, CA | San Jose, CA | Seattle, WA | St. Louis, MO | Tampa, FL | Tucson, AZ | Washington D.C. | West Palm Beach, FL
| Metro Area | Rank | Neighborhood | Median Sale Price | Average Sale-to-List Price Ratio | % of Homes that Sold Above List Price |
Median Days on Market
|
| Atlanta, GA | ||||||
| 1 | Hunter Hills | $57,000 |
92.0% |
23.1% | 21 | |
| 2 | Princeton Lakes | $218,000 | 96.8% | 15.4% | 52 | |
| 3 | Washington Park | $85,000 | 102.7% | 43.8% | 37 | |
| Austin, TX | ||||||
| 1 | South Lamar | $422,250 |
97.7% |
5.4% | 55 | |
| 2 | North Lamar | $225,500 | 96.9% | 16.7% | 16 | |
| 3 | North University | $363,650 | 94.4% | 11.1% | 40 | |
| Bakersfield, CA | ||||||
| 1 | Haggin Oaks | $254,000 |
100.0% |
0.0% | 15 | |
| 2 | Tevis Ranch | $240,000 | 100.0% | 0.0% | 29 | |
| 3 | The Seasons | $214,000 | 100.0% | 0.0% | 38 | |
| Baltimore, MD | ||||||
| 1 | Charles Village | $254,000 |
98.4% |
16.7% | 43 | |
| 2 | Dorchester | $91,250 | 106.3% | 33.3% | 31 | |
| 3 | Roland Park | $620,000 | 96.3% | 0.0% | 28 | |
| Boston, MA | ||||||
| 1 | Downtown Medford | $534,750 |
102.0% |
50.0% | 12 | |
| 2 | Newton Corner | $1,015,000 | 100.7% | 48.4% | 10 | |
| 3 | Suffolk Square | $423,500 | 104.6% | 66.7% | 10 | |
| Buffalo, NY | ||||||
| 1 | Abbott McKinley | $142,994 |
100.1% |
47.1% | 23 | |
| 2 | Elmwood | $315,000 | 97.3% | 19.5% | 32 | |
| 3 | Maryvale | $105,500 | 100.6% | 45.2% | 15 | |
| Charlotte, NC | ||||||
| 1 | Pawtuckett | $141,050 |
102.1% |
58.3% | 60 | |
| 2 | Fourth Ward | $260,000 | 97.5% | 5.7% | 66 | |
| 3 | Oakdale North | $198,000 | 99.4% | 20.0% | 62 | |
| Chicago, IL | ||||||
| 1 | Country Lakes | $207,250 |
97.3% |
0.0% | 57 | |
| 2 | Belmont Gardens | $278,950 | 97.5% | 15.0% | 73 | |
| 3 | North Lawndale | $127,000 | 93.0% | 13.3% | 64 | |
| Cincinnati, OH | ||||||
| 1 | Norwood | $137,950 |
94.6% |
4.1% | 63 | |
| 2 | Avondale | $110,000 | 94.6% | 11.1% | 64 | |
| 3 | Mount Auburn | $101,000 | 92.6% | 11.8% | 68 | |
| Cleveland, OH | ||||||
| 1 | Cedar Fairmont | $319,000 |
97.9% |
6.3% | 53 | |
| 2 | Warehouse District | $146,500 | 95.4% | 0.0% | 122 | |
| 3 | Bay Village | $230,000 | 96.8% | 16.1% | 47 | |
| 1 | Garden Ranch | $255,000 |
101.2% |
44.4% | 16 | |
| 2 | Venetian Village | $227,500 | 98.8% | 25.0% | 26 | |
| 3 | Old Farm | $269,750 | 96.6% | 0.0% | 59 | |
| Columbus, OH | ||||||
| 1 | Misty Meadows | $161,500 |
99.3% |
20.0% | 51 | |
| 2 | Central Clintonville | $305,500 | 97.1% | 6.3% | 62 | |
| 3 | Strawberry Farms | $169,400 | 100.1% | 54.6% | 40 | |
| 1 | Waterview | $315,000 | n/a |
0.0% |
72 | |
| 2 | Alamo Heights | $199,900 | n/a | 0.0% | 46 | |
| 3 | Western Hills North | $169,900 | n/a | 0.0% | 49 | |
| Denver, CO | ||||||
| 1 | Green Mountain Park | $475,000 |
99.0% |
22.2% | 28 | |
| 2 | Applewood | $473,500 | 97.3% | 8.0% | 55 | |
| 3 | Regis | $441,000 | 100.4% | 54.8% | 46 | |
| Detroit, MI | ||||||
| 1 | Southwest Detroit | $35,000 |
96.7% |
24.4% | 34 | |
| 2 | Pleasant Ridge | $245,000 | 97.9% | 30.0% | 28 | |
| 3 | Northwest Warren | $156,700 | 98.7% | 27.0% | 23 | |
| 1 | Royal Land | $82,000 |
95.4% |
0.0% | 70 | |
| 2 | Carriage Hills | $90,550 | 93.9% | 0.0% | 73 | |
| 3 | Poinsettia Heights | $434,500 | 95.7% | 7.1% | 65 | |
| 1 | River Walk | $235,000 |
99.3% |
15.4% | 71 | |
| 2 | West Ghent | $265,000 | 96.2% | 0.0% | 100 | |
| 3 | Dunedin | $164,000 | 95.2% | 25.0% | 37 | |
| Houston, TX | ||||||
| 1 | Lawndale-Wayside | $239,000 |
95.1% |
15.8% | 49 | |
| 2 | Sea Isle | $295,000 | 95.7% | 7.7% | 110 | |
| 3 | El Lago | $216,000 | 96.2% | 6.7% | 34 | |
| Jacksonville, FL | ||||||
| 1 | Deercreek | $427,500 |
96.8% |
17.7% | 67 | |
| 2 | Southside | $260,000 | 94.0% | 0.0% | 123 | |
| 3 | University Park | $181,750 | 97.9% | 16.7% | 31 | |
| Kansas City, MO | ||||||
| 1 | Hyde Park | $215,000 | n/a |
0.0% |
39 | |
| 2 | Briarcliff | $187,988 | n/a | 0.0% | 35 | |
| 3 | Shawnee | $269,925 | 91.1% | 0.0% | 36 | |
| Las Vegas, NV | ||||||
| 1 | Summerlin West | $459,900 |
98.4% |
13.2% | 77 | |
| 2 | Green Valley Ranch | $309,000 | 98.4% | 9.9% | 58 | |
| 3 | Centennial Hills | $258,000 | 99.0% | 26.1% | 53 | |
| Long Island, NY | ||||||
| 1 | South Huntington | $420,000 |
96.5% |
16.3% | 44 | |
| 2 | Manhasset Hills | $899,000 | 98.2% | 21.4% | 59 | |
| 3 | North Babylon | $357,000 | 98.5% | 32.8% | 39 | |
| Los Angeles, CA | ||||||
| 1 | Annandale | $1,203,500 |
104.6% |
60.0% | 34 | |
| 2 | Los Altos North | $643,000 | 100.0% | 27.3% | 41 | |
| 3 | McNeil | $801,000 | 102.5% | 79.0% | 43 | |
| Memphis, TN | ||||||
| 1 | Poplar Pines | $375,000 |
96.9% |
5.9% | 67 | |
| 2 | Germantown | $300,050 | 95.4% | 10.7% | 61 | |
| 3 | High Point Terrace | $252,000 | 98.3% | 23.1% | 44 | |
| Miami, FL | ||||||
| 1 | Granada | $494,500 |
99.8% |
9.1% | 145 | |
| 2 | Sunset West | $437,500 | 93.4% | 10.7% | 69 | |
| 3 | Little Haiti | $205,000 | 97.6% | 17.7% | 61 | |
| Milwaukee, WI | ||||||
| 1 | Brewer’s Hill | $260,000 |
97.4% |
22.2% | 63 | |
| 2 | Murray Hill | $185,500 | 93.3% | 0.0% | 79 | |
| 3 | Historic Third Ward | $247,450 | 97.6% | 10.0% | 55 | |
| 1 | Stevens Square | $117,000 |
98.5% |
33.3% | 55 | |
| 2 | East Harriet | $363,000 | 99.8% | 27.8% | 36 | |
| 3 | Jordan | $145,000 | 99.9% | 40.7% | 36 | |
| New Orleans, LA | ||||||
| 1 | East Riverside | $499,000 |
97.2% |
7.7% | 80 | |
| 2 | Bywater | $345,000 | 93.6% | 7.7% | 75 | |
| 3 | Pontchartrain Shores | $265,000 | 96.4% | 7.7% | 84 | |
| Oakland, CA | ||||||
| 1 | Blacow | $1,005,000 |
109.4% |
91.7% | 10 | |
| 2 | Fairfax | $640,000 | 111.0% | 69.2% | 20 | |
| 3 | Grand Lake | $823,000 | 112.7% | 80.0% | 15 | |
| 1 | Stonegate | $938,500 |
99.6% |
46.2% | 35 | |
| 2 | Portola Springs | $875,000 | 98.4% | 15.5% | 67 | |
| 3 | Woodbury | $800,000 | 99.3% | 31.3% | 41 | |
| Orlando, FL | ||||||
| 1 | Richmond Heights | $125,000 |
99.4% |
42.9% | 15 | |
| 2 | Audubon Park | $248,000 | 97.2% | 21.4% | 18 | |
| 3 | Falcon Trace | $259,000 | 96.8% | 0.0% | 73 | |
| Philadelphia, PA | ||||||
| 1 | Fitler Square | $715,000 |
97.2% |
11.8% | 70 | |
| 2 | Southwest Germantown | $99,500 | 97.7% | 37.0% | 36 | |
| 3 | Roxborough | $240,000 | 97.9% | 11.5% | 76 | |
| Phoenix, AZ | ||||||
| 1 | Arcadia | $552,500 |
96.9% |
5.7% | 55 | |
| 2 | Vistancia | $359,000 | 98.1% | 7.1% | 58 | |
| 3 | Warner Ranch | $331,750 | 96.7% | 6.3% | 42 | |
| Pittsburgh, PA | ||||||
| 1 | Mount Washington | $132,000 |
94.4% |
13.9% | 68 | |
| 2 | Highland Park | $315,000 | 92.5% | 0.0% | 103 | |
| 3 | Point Breeze | $408,500 | 96.2% | 25.0% | 61 | |
| Portland, OR | ||||||
| 1 | Hillside | $950,000 |
97.2% |
15.4% | 47 | |
| 2 | North Tabor | $405,000 | 99.9% | 36.4% | 46 | |
| 3 | Gresham | $280,000 | 99.6% | 36.8% | 14 | |
| Providence, RI | ||||||
| 1 | Fairmount | $170,000 |
98.2% |
30.8% | 27 | |
| 2 | Washington Park | $199,000 | 99.8% | 37.5% | 60 | |
| 3 | Elmhurst | $210,000 | 98.5% | 34.8% | 61 | |
| Queens, NY | ||||||
| 1 | Clearview | $703,500 |
97.7% |
23.5% | 58 | |
| 2 | Maspeth | $818,000 | 96.0% | 15.9% | 50 | |
| 3 | Briarwood | $315,000 | 97.7% | 25.5% | 50 | |
| 1 | San Gorgonio | $275,000 |
102.0% |
81.8% | 38 | |
| 2 | Chase Ranch | $511,000 | 100.3% | 63.6% | 46 | |
| 3 | Murrieta Highlands | $400,000 | 99.4% | 44.4% | 30 | |
| Sacramento, CA | ||||||
| 1 | Upper Land Park | $458,000 |
98.6% |
33.3% | 27 | |
| 2 | Elmhurst | $521,500 | 102.0% | 50.0% | 11 | |
| 3 | River Park | $524,500 | 99.2% | 33.3% | 24 | |
| San Antonio, TX | ||||||
| 1 | Helotes | $310,000 |
97.6% |
7.7% | 65 | |
| 2 | Castle Hills Forest | $250,000 | 98.4% | 22.2% | 35 | |
| 3 | Woodstone | $140,000 | 98.6% | 36.8% | 47 | |
| San Diego, CA | ||||||
| 1 | Scripts Ranch | $1,375,000 |
99.1% |
17.7% | 70 | |
| 2 | Otay Ranch | $375,000 | 98.3% | 11.1% | 21 | |
| 3 | South Oceanside | $737,500 | 99.2% | 25.0% | 53 | |
| San Francisco, CA | ||||||
| 1 | Sunnyside | $1,275,000 |
125.0% |
89.5% | 15 | |
| 2 | Mission Terrace | $1,014,500 | 111.8% | 75.0% | 15 | |
| 3 | Ingleside | $1,100,000 | 118.1% | 76.9% | 19 | |
| San Jose, CA | ||||||
| 1 | Bucknall | $1,565,000 |
123.8% |
100.0% | 11 | |
| 2 | Cambrian | $1,244,000 | 118.0% | 100.0% | 9 | |
| 3 | White Oak | $1,010,000 | 105.7% | 66.7% | 14 | |
| Seattle, WA | ||||||
| 1 | First Hill | $580,000 |
103.9% |
65.7% | 7 | |
| 2 | Central District | $544,475 | 98.2% | 0.0% | 13 | |
| 3 | Cedar Park | $586,000 | 101.4% | 42.1% | 15 | |
| St. Louis, MO | ||||||
| 1 | Downtown St. Louis | $139,900 |
95.9% |
4.4% | 98 | |
| 2 | Shaw Historic District | $280,050 | 98.1% | 19.2% | 56 | |
| 3 | Benton Park West | $61,538 | 95.2% | 26.1% | 55 | |
| Tampa, FL | ||||||
| 1 | Island Estate | $355,000 |
94.1% |
5.6% | 93 | |
| 2 | Greater Woodlawn | $347,000 | 100.0% | 25.0% | 26 | |
| 3 | Childs Park | $65,500 | 91.4% | 17.9% | 33 | |
| Tucson, AZ | ||||||
| 1 | Civano | $250,000 |
99.3% |
13.8% | 63 | |
| 2 | Groves Lincoln Park | $138,600 | 101.2% | 35.0% | 43 | |
| 3 | Amphi | $128,250 | 95.4% | 12.5% | 98 | |
| Washington, DC | ||||||
| 1 | Hillcrest | $125,000 |
96.8% |
25.0% | 42 | |
| 2 | Deanwood | $248,500 | 100.5% | 50.0% | 21 | |
| 3 | Bluemont | $729,000 | 98.9% | 21.1% | 26 | |
| 1 | Forest Hill Village | $192,450 |
98.6% |
8.3% | 72 | |
| 2 | Pheasant Walk | $430,000 | 96.3% | 12.5% | 47 | |
| 3 | Boca Chase | $350,000 | 97.3% | 3.7% | 84 |


 United States
 Canada