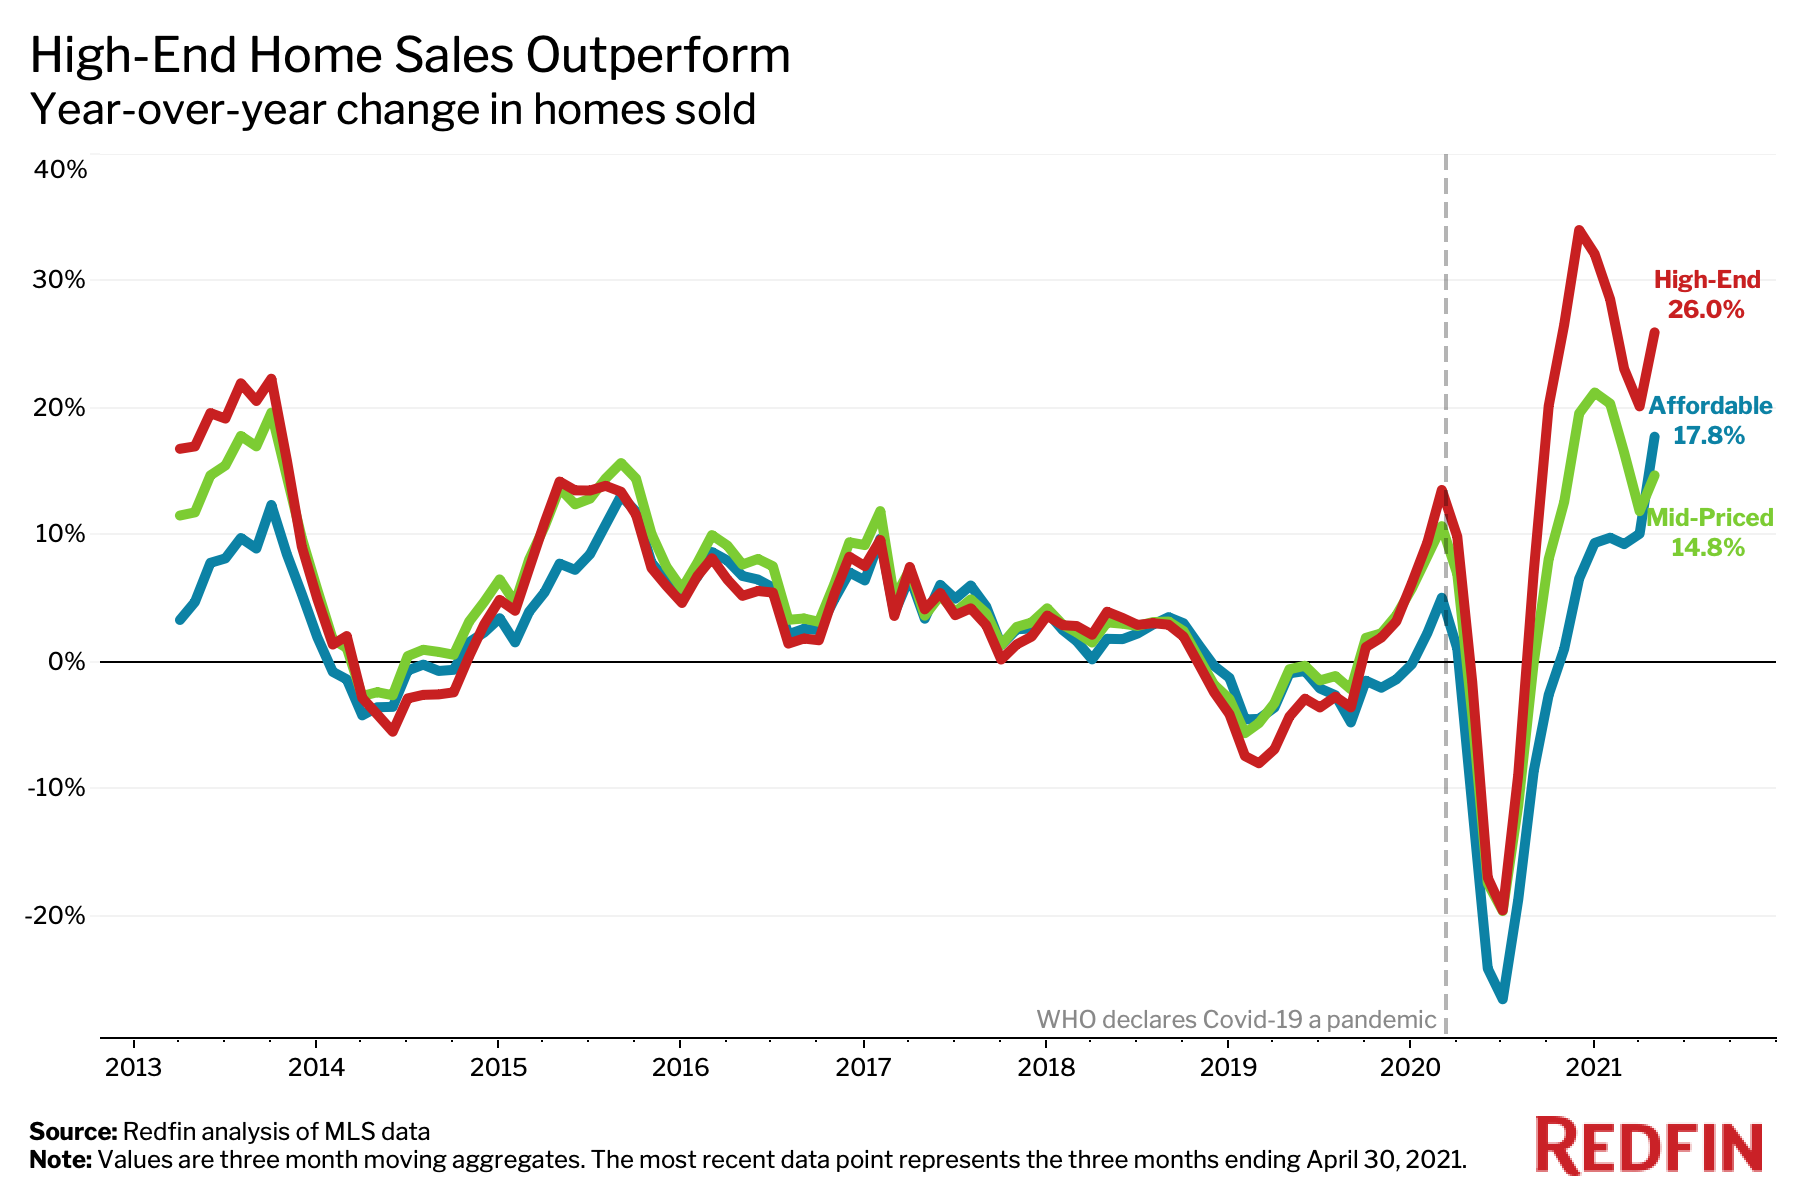
- Purchases of high-end homes jumped 26% in the three months ending April 30, versus a 15% increase for mid-priced homes. High-end sales rose the most in expensive metros including San Francisco and San Jose.
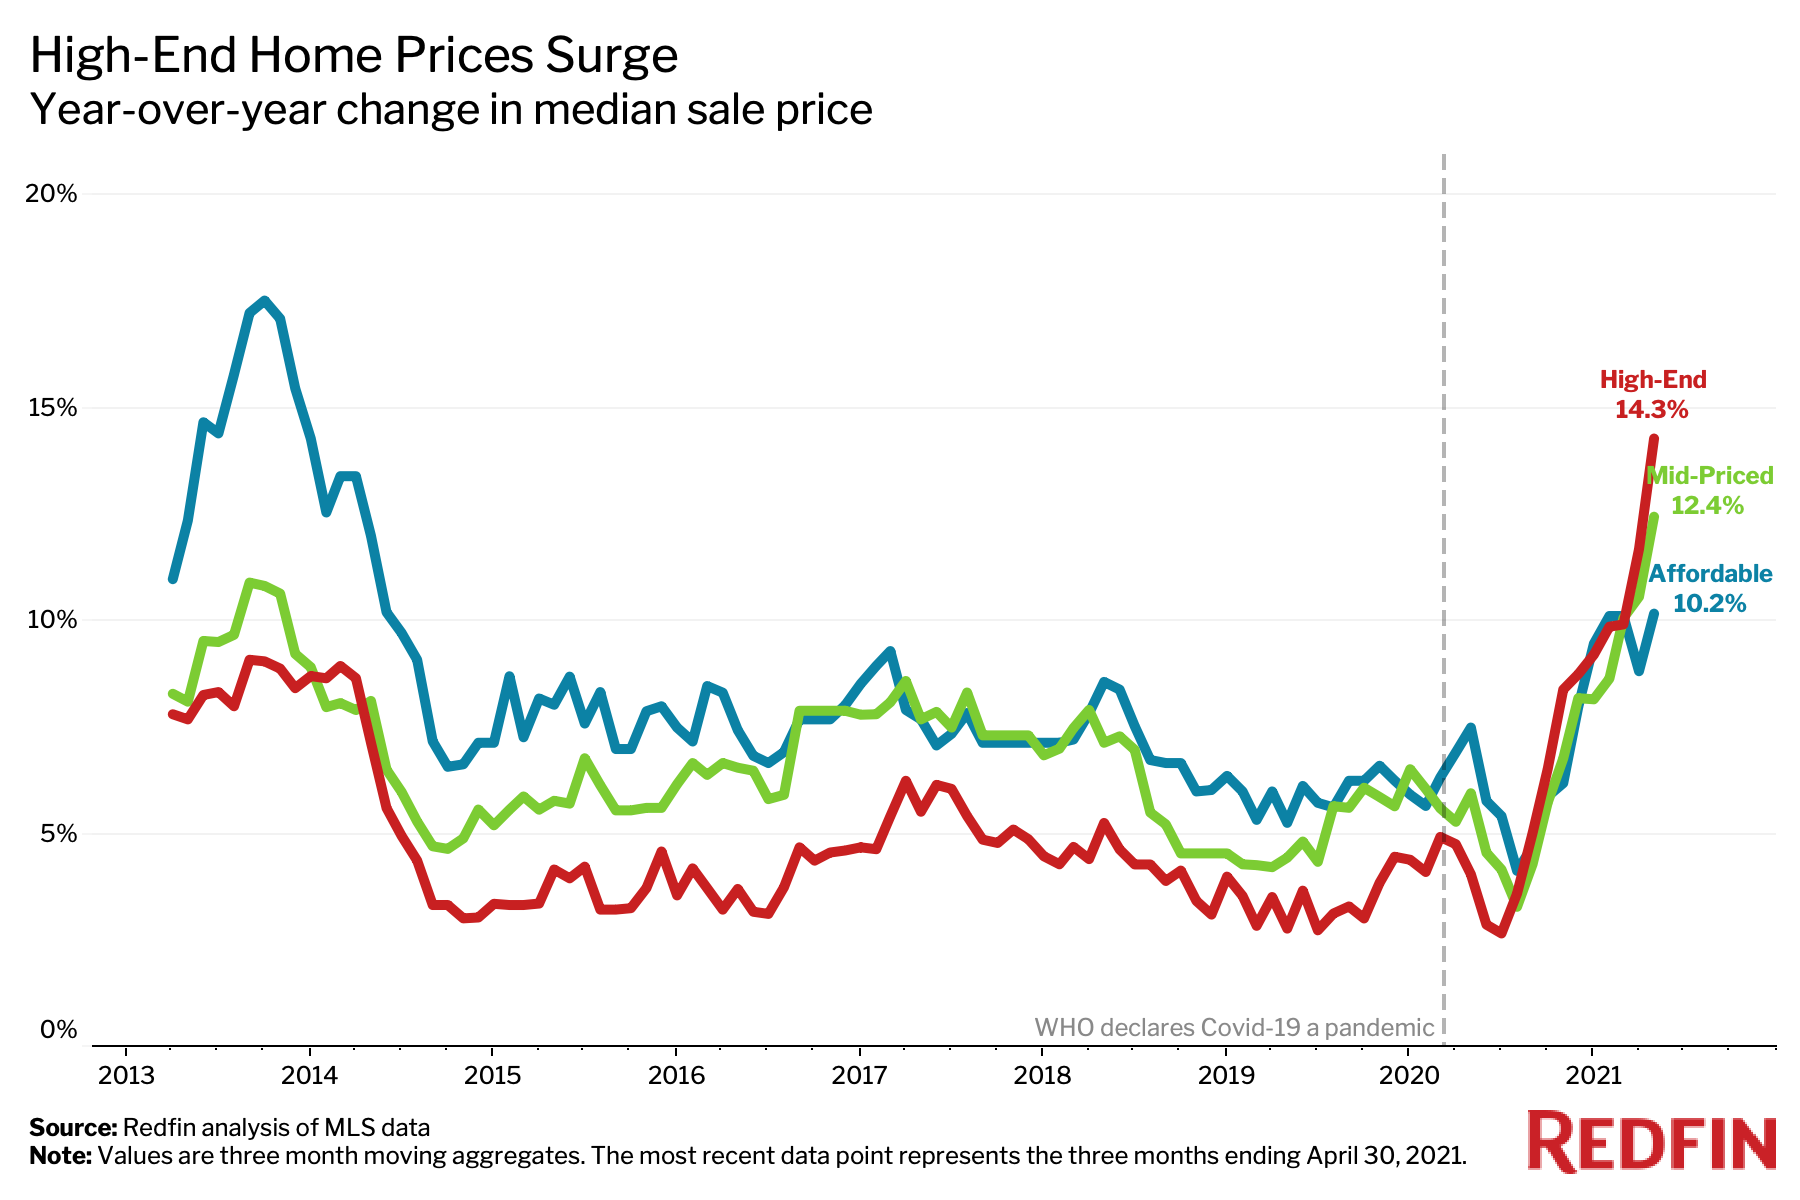
- Prices of high-end homes also saw a relatively big climb, up 14%, versus a 10% rise for affordable homes. The biggest gains were in popular migration destinations including Austin and Phoenix.
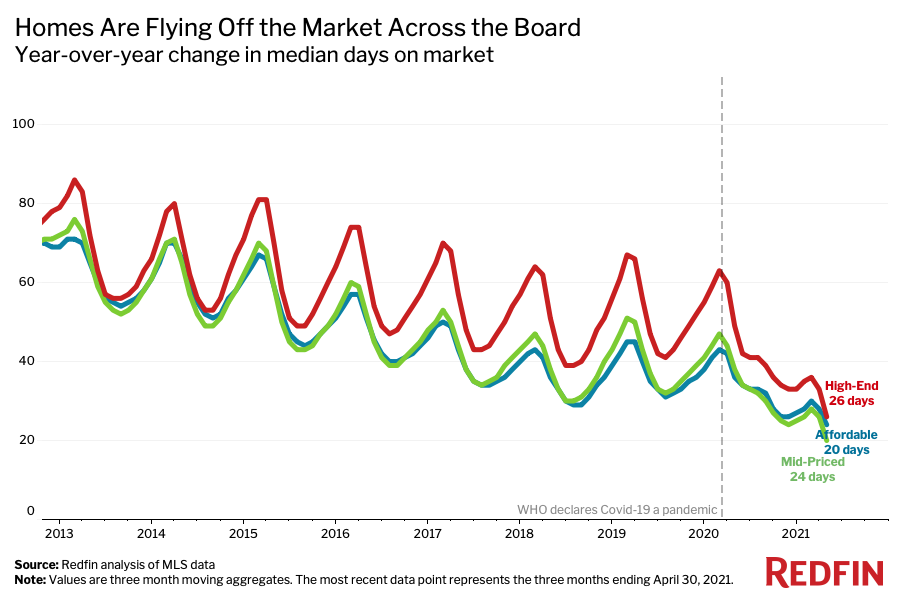
- Homes in every price tier are selling in less than 4 weeks—significantly faster than a year ago.
Purchases of high-end homes in the U.S. jumped 26% year over year during the three months ending April 30, outpacing the 17.8% gain in purchases of affordable homes and the 14.8% increase in purchases of mid-priced homes.

This is according to a Redfin analysis that divides U.S. residential properties into three equal-sized buckets—high-end, mid-priced and affordable—based on Redfin Estimates of the homes’ market values. Scroll down to the methodology section at the bottom of this report to read more about how we determine which homes are in each bucket. It’s important to note that year-over-year changes in this report may be somewhat exaggerated because pandemic stay-at-home orders halted homebuying and selling around this time last year.
Purchases of high-end homes have soared as wealthy Americans have reaped the benefits of a strong stock market, swelling savings accounts and remote work. A relative abundance of high-end homes hitting the market has also enabled purchases in that segment of the market to flourish.
“So far, the economic recovery from the pandemic has disproportionately benefited Americans with bigger bank accounts,” said Redfin Chief Economist Daryl Fairweather. “This means a lot of the demand for homes is coming from folks who are well-off, while many lower-income Americans sit on the sidelines because they’ve been priced out of the housing market due to surging prices.”
U.S. Housing Market Summary, Three Months Ending April 30, 2021
| High-End | Mid-Priced | Affordable | |
|---|---|---|---|
| Homes sold, YoY change | 26% | 14.8% | 17.8% |
| Median sale price, YoY change | 14.3% | 12.4% | 10.2% |
| Median sale price | $440,000 | $280,000 | $189,500 |
| Median days on market | 26 (-23 days YoY) | 20 (-18 days YoY) | 24 (-12 days YoY) |
| New listings, YoY change | 19.3% | 9.1% | 13.9% |
The surge in purchases of expensive properties was led by San Francisco, which saw an 82.4% jump in high-end home sales during the three months ending April 30—the biggest gain among the 50 most populous U.S. metropolitan areas. Next came Oakland, CA (+71.8%), Miami (+70.4%), San Jose, CA (+66%) and Las Vegas (+64.4%)
“Growth in high-end-home sales is currently skewed toward some of the most expensive markets in the country—like the Bay Area and parts of Florida—which is fueling an uptick in high-end home prices,” Fairweather said. “The high-end sales growth in Florida is being fueled by an influx of affluent out-of-staters, while the gain in the Bay Area is more of a recovery from the massive decline in sales the region experienced at the start of the pandemic when scores of Americans left big cities. Folks may be starting to feel more comfortable putting down roots in major hubs now that they’re gaining clarity on post-pandemic life.”
Prices of High-End Homes Are Growing Faster Than Prices of Affordable and Mid-Priced Homes
Prices of high-end homes in the U.S. rose a record 14.3% year over year during the three months ending April 30. By comparison, prices of mid-priced homes climbed a record 12.4% and prices of affordable homes increased 10.2%. When we discuss “record” changes, we are referring to Redfin’s records, which date back to 2013.
“As the economic recovery starts to touch more middle-class Americans, we expect to see price growth accelerate for affordable and mid-priced homes,” Fairweather said.

High-end home prices rose in all of the 50 most populous U.S. metropolitan areas. Austin, TX led the way with a 24.1% jump, followed by San Diego, CA (+18%), Miami (+17.7%), West Palm Beach, FL (17.6%) and Phoenix (+17.2%).
Many of the metros at the top of this list are popular destinations for people who have left big cities in search of relative affordability, space and/or sunshine during the pandemic. Phoenix was the number-one destination for Redfin.com users looking to move to a different area in April, with Austin and Miami not far behind. That’s based on net inflow—a measure of how many more Redfin.com home searchers looked to move into a metro than leave.
“In the high-end market, we’re not only seeing multiple offers—we’re seeing buyers waiving appraisal and inspection contingencies, which doesn’t normally happen,” said Vincent Shook, a Redfin real estate agent in Phoenix. “The biggest driver is the influx of people from California. Still, competition remains toughest for buyers of affordable and mid-priced homes.”
Shook continued: “Some buyers with more modest budgets are coming to me and saying, ‘I want a four-bedroom home and here’s my maximum price.’ I’ve had conversations where I’ve had to be brutally honest and tell them that home literally does not exist anymore. It existed eight months ago when they started looking, but they wanted to wait in hopes that prices would come down. Prices didn’t come down, and now they’re priced out of the market.”
The Number of High-End Homes Hitting the Market is on the Rise
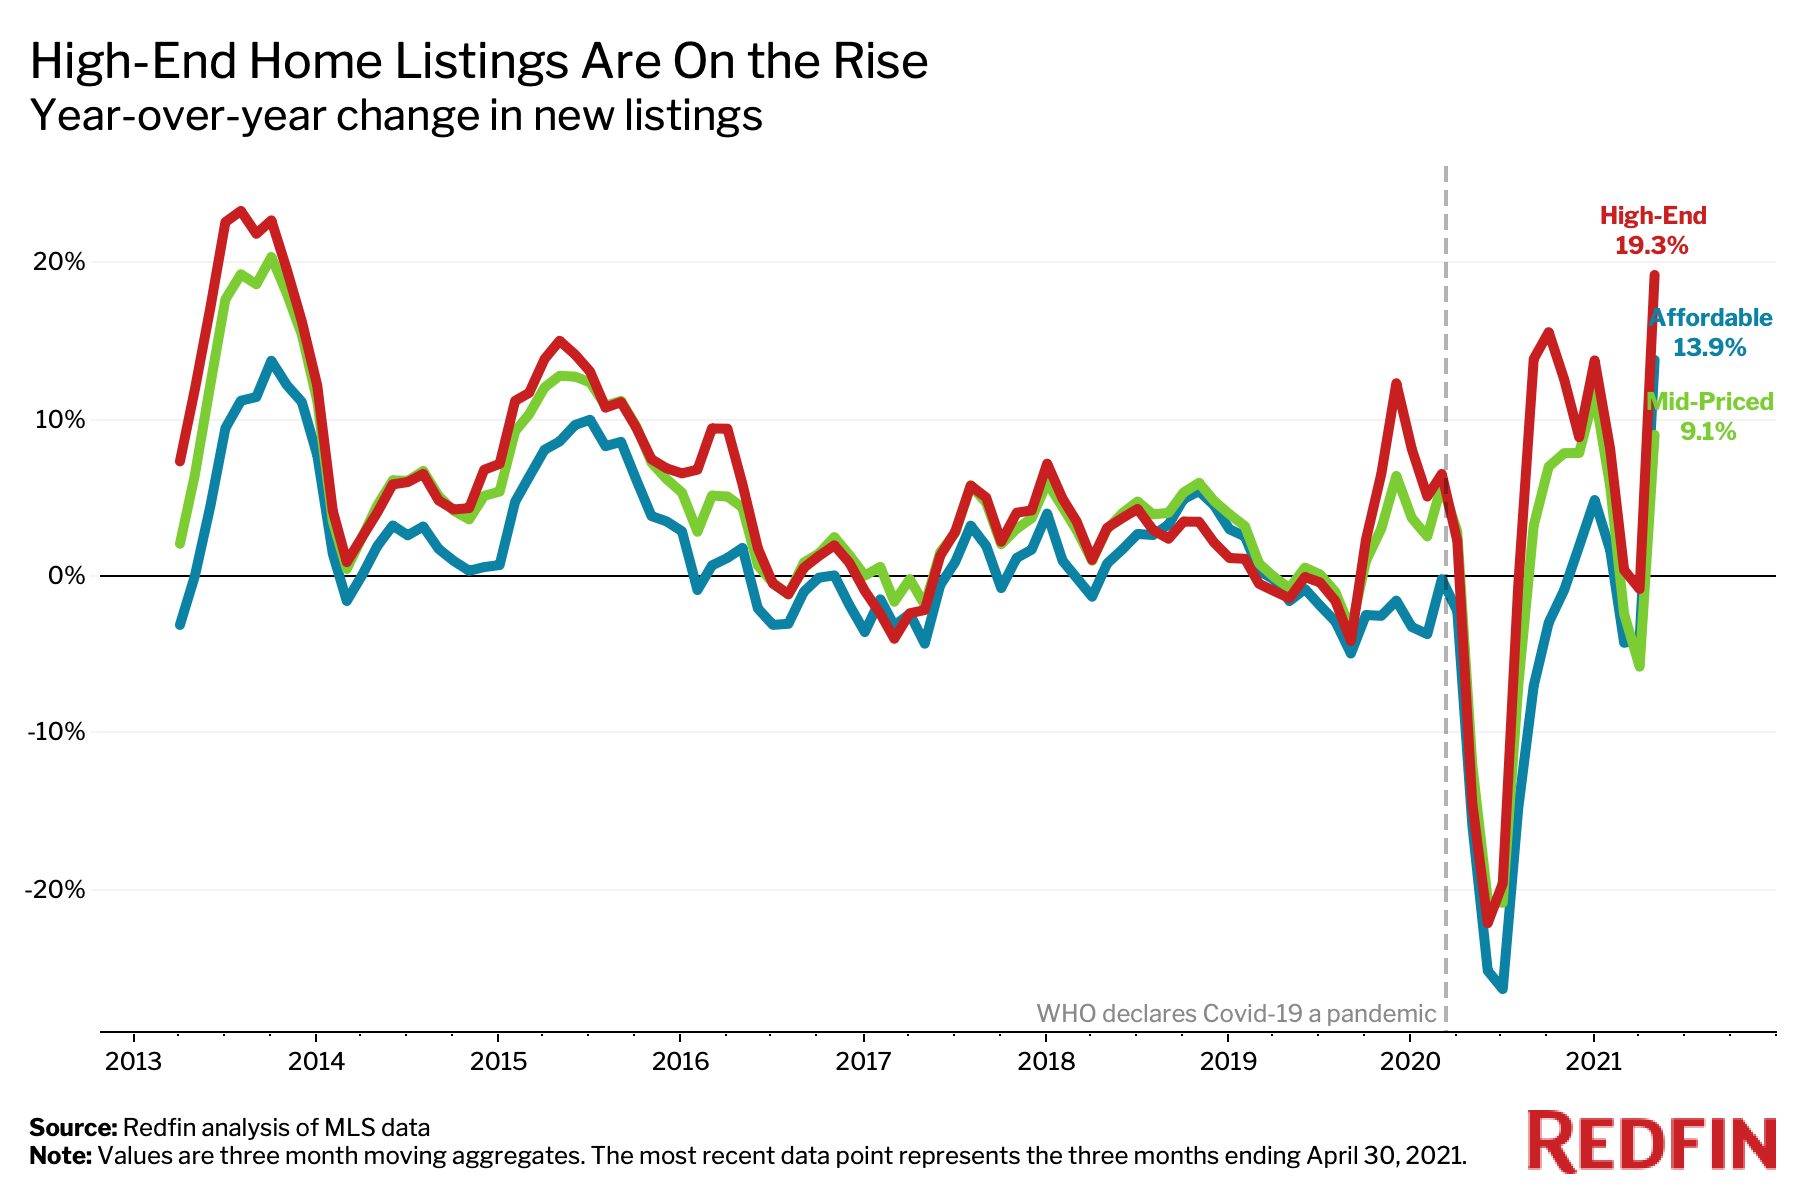
Listings of high-end homes rose 19.3% year over year during the three months ending April 30—outpacing a 13.9% gain in affordable listings and a 9.1% increase in mid-priced listings.

Homes of Every Price Are Flying Off the Shelves
The typical high-end home that was for sale during the three months ending April 30 spent 26 days on the market—23 fewer days than the same period in 2020. Affordable homes spent 24 days on the market (12 fewer days than a year earlier) and mid-priced homes spent 20 days on the market (18 fewer days than a year earlier).
While high-end homes still take the longest to sell, the gap has nearly closed, as seen in the chart below. The typical high-end home took just two more days to sell than the typical affordable home during the three months ending April 30, compared with 13 days longer during the same period a year earlier.

“High-end homes are flying off the market because the pandemic has fueled an uptick in demand for high-end amenities,” Fairweather said. “People are snapping up properties with home offices, big backyards and more square footage.”
Summary of Housing Market by Metro Area (50 Most Populous): Three Months Ending April 30, 2021
Methodology
We divided U.S. residential properties into three buckets based on Redfin Estimates of the homes’ market values as of May 25, 2021. The “affordable” bucket contains homes that rank in the 5th-35th percentile in market value, the “mid-priced” bucket contains homes in the 35th-65th percentile, and the “high-end” bucket contains homes estimated in the 65th-95th. This analysis excludes homes in the bottom 5% and top 5% of the market.


 United States
 Canada