Landlords may have more leeway to raise rents next year because apartment construction is slowing, which could eventually lead to more renters than vacant units.
The median U.S. asking rent rose 0.4% year over year to $1,607 in February. While that’s a small gain, it’s the first increase in six months and the biggest in nine months.

On a month-over-month basis, asking rents climbed 0.6%.
Though asking rents inched up in February, they’ve been relatively flat for the past 10 months compared to the large swings of the past few years. Rents skyrocketed as much as 18% year over year during the pandemic moving frenzy in 2021, and then fell as much as 4% in 2023. Asking rents are now flattening because rental supply and demand are near equilibrium.
“The era of big rent declines is over for most of the country,” said Redfin Senior Economist Sheharyar Bokhari. “A ton of new apartments have hit the market, and demand for those apartments is strong because it’s so expensive to buy a home. But apartment construction is starting to slow, which means there may be more renters than apartments to go around as soon as next year. That could cause rents to tick up and the perks that many renters have grown accustomed to—like free parking—to disappear.”
Asking rents drop most in Austin, rise most in Cincinnati
In Austin, TX, the median asking rent dropped 9.4% year over year in February to $1,404—the largest decline among the 44 major U.S. metropolitan areas Redfin analyzed. It’s now 22% below its August 2023 record high.
Salt Lake City was home to the second largest decline (-7.8%), followed by Jacksonville, FL (-6.7%), Minneapolis (-5.9%) and San Diego (-5.6%).
Asking rents have been falling quickly in parts of Texas and Florida because those states have been building more housing than other states. Florida has also been grappling with intensifying natural disasters, which has made some people hesitant to live there.
Rents rose most in Cincinnati (15.3%), Providence, RI (12.4%), Baltimore (9.6%), Washington, D.C. (9.2%) and Cleveland (8.5%).
Asking rents tick up for smaller apartments, but tick down for larger apartments
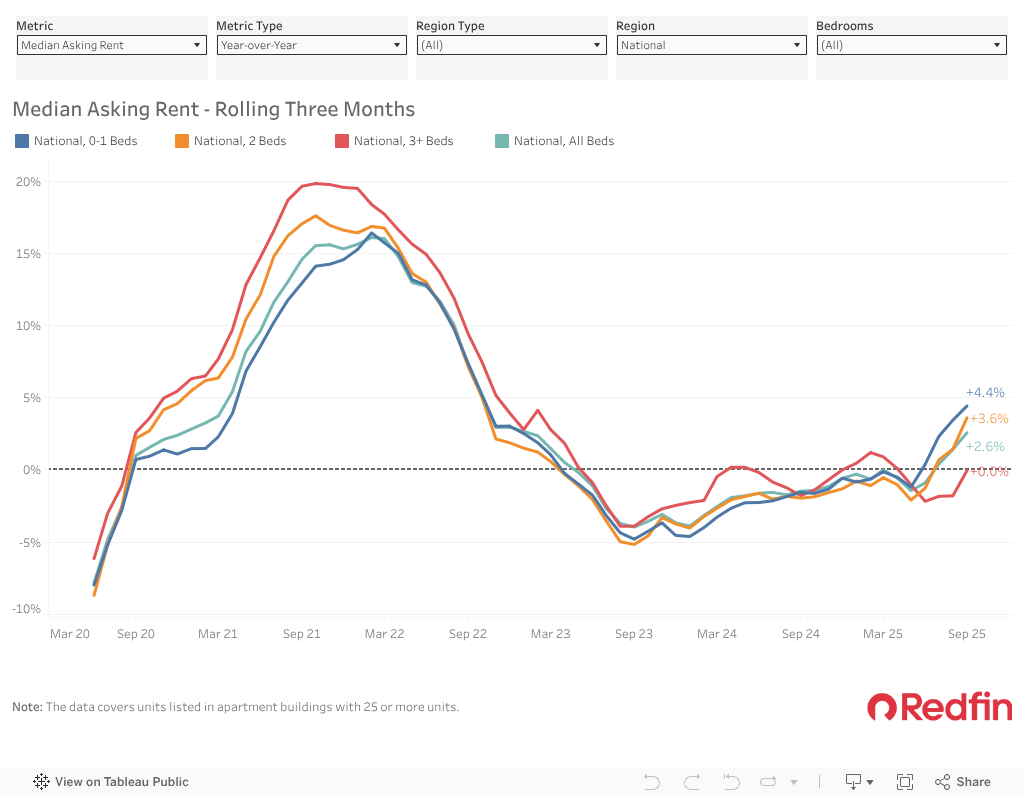
The median asking rent for 0-1 bedroom apartments rose 0.4% year over year to $1,467—the first increase since June. The median asking rent for 2 bedroom apartments rose 0.6% to $1,689—also the first increase since June.
The median asking rent for 3+ bedroom apartments fell 0.5% to $1,990, though that was the smallest decline in months.
Metro-level summary: February 2025
| U.S. metro area | Median asking rent | YoY change in median asking rent | MoM change in median asking rent | Median asking rent per square foot | YoY change in median asking rent per square foot | MoM change in median asking rent per square foot |
|---|---|---|---|---|---|---|
| Atlanta, GA | $1,528 | 0.9% | -0.1% | $1.57 | -1.3% | 0.1% |
| Austin, TX | $1,404 | -9.4% | 0.4% | $1.63 | -9.9% | 1.4% |
| Baltimore, MD | $1,605 | 9.6% | 0.3% | $1.74 | 7.6% | 0.5% |
| Birmingham, AL | $1,368 | 2.5% | 1.0% | $1.30 | 0.1% | -0.2% |
| Boston, MA | $2,722 | 6.3% | 1.4% | $3.21 | 3.2% | 4.0% |
| Buffalo, NY | $1,293 | 3.8% | 0.5% | $1.67 | 0.7% | -0.4% |
| Charlotte, NC | $1,485 | 1.0% | 0.4% | $1.58 | -0.7% | 0.9% |
| Chicago, IL | $1,719 | 6.7% | 0.6% | $2.19 | 6.0% | 1.1% |
| Cincinnati, OH | $1,453 | 15.3% | 2.7% | $1.60 | 7.8% | 2.5% |
| Cleveland, OH | $1,270 | 8.5% | -1.3% | $1.45 | 6.6% | -0.3% |
| Columbus, OH | $1,406 | 3.1% | 0.8% | $1.56 | 8.7% | 1.4% |
| Dallas, TX | $1,454 | -5.5% | 0.3% | $1.73 | -3.0% | 0.0% |
| Denver, CO | $1,687 | -0.7% | 0.4% | $2.07 | -5.7% | 0.1% |
| Detroit, MI | $1,350 | 1.9% | 1.4% | $1.54 | 4.4% | 1.3% |
| Houston, TX | $1,239 | -1.7% | 0.4% | $1.44 | -5.3% | 0.7% |
| Indianapolis, IN | $1,395 | 3.3% | 1.5% | $1.53 | 4.8% | 0.6% |
| Jacksonville, FL | $1,455 | -6.7% | 0.0% | $1.55 | -3.2% | 0.4% |
| Las Vegas, NV | $1,486 | 2.5% | 1.2% | $1.65 | -0.8% | 0.5% |
| Los Angeles, CA | $2,760 | -1.3% | -0.4% | $3.37 | 2.0% | 0.2% |
| Louisville/Jefferson County, KY | $1,265 | 8.1% | 1.3% | $1.38 | 15.0% | 1.5% |
| Memphis, TN | $1,221 | 4.2% | 1.4% | $1.24 | 2.9% | 1.6% |
| Miami, FL | $2,412 | 1.5% | 1.3% | $2.54 | 4.1% | 2.8% |
| Minneapolis, MN | $1,525 | -5.9% | -1.2% | $1.89 | -3.5% | 0.1% |
| Nashville, TN | $1,535 | -2.5% | 1.3% | $1.75 | 3.3% | 1.2% |
| New York, NY | $2,840 | -4.4% | 0.5% | $3.52 | -2.9% | 0.3% |
| Orlando, FL | $1,739 | -1.9% | 0.5% | $1.80 | -4.0% | -0.3% |
| Philadelphia, PA | $1,875 | 1.4% | 1.1% | $2.18 | -0.1% | 1.0% |
| Phoenix, AZ | $1,482 | -1.2% | 0.5% | $1.79 | -0.2% | 1.0% |
| Pittsburgh, PA | $1,450 | 1.0% | 2.6% | $1.74 | 5.2% | 1.9% |
| Portland, OR | $1,750 | -5.2% | 0.0% | $2.01 | -3.7% | -0.1% |
| Providence, RI | $2,155 | 12.4% | 0.2% | $2.58 | 10.0% | 0.0% |
| Raleigh, NC | $1,420 | -3.7% | 0.9% | $1.53 | -0.1% | 2.2% |
| Richmond, VA | $1,566 | 1.1% | 0.2% | $1.72 | -0.9% | 0.4% |
| Riverside, CA | $2,329 | 1.3% | 1.2% | $2.61 | 2.8% | 0.5% |
| Sacramento, CA | $2,011 | 4.7% | 0.6% | $2.33 | -1.8% | 0.3% |
| Salt Lake City, UT | $1,499 | -7.8% | 1.6% | $1.86 | -8.8% | 3.4% |
| San Diego, CA | $2,658 | -5.6% | -0.9% | $3.20 | -4.3% | -1.1% |
| San Francisco, CA | $2,695 | -2.0% | 0.1% | $3.52 | -6.8% | 0.1% |
| San Jose, CA | $3,225 | 2.9% | 1.6% | $3.77 | 8.7% | 1.7% |
| Seattle, WA | $2,075 | 1.9% | 1.2% | $2.71 | -2.4% | 1.3% |
| St. Louis, MO | $1,252 | -2.9% | 1.3% | $1.47 | -2.0% | 0.8% |
| Tampa, FL | $1,773 | -0.5% | 2.8% | $1.92 | -2.1% | -0.4% |
| Virginia Beach, VA | $1,550 | 8.1% | 0.0% | $1.68 | 8.3% | -0.1% |
| Washington, D.C. | $2,045 | 9.2% | 0.0% | $2.35 | 9.2% | 0.5% |
| National | $1,607 | 0.4% | 0.6% | $1.81 | -0.4% | 1.0% |
Methodology
Median asking rent figures in this report cover newly listed units in apartment buildings with five or more units. The median is calculated based on a rolling three-month period, i.e., the median asking rent for February 2025 covers rentals that were listed on Rent.com and Redfin.com during the three months ending Feb. 28, 2025.
Metro-level data in this report covers 44 of the 50 most populous U.S. core-based statistical areas (CBSAs)—those for which Rent. and Redfin have sufficient rental data. The national figures are based on data for the entire U.S.
Asking rents reflect the current costs of new leases during each time period. In other words, the amount shown as the median asking rent is not the median of what all renters are paying, but the median asking price of apartments that were available for new renters during the report period.


 United States
 Canada