
In San Francisco, San Jose, Los Angeles and Boston, the value of land accounts for more than half of a typical home’s value. Land’s share of home value is roughly 20 percent in Buffalo, Omaha, Indianapolis and Cincinnati.
Potential homebuyers are priced out because of high land costs making homes very expensive.
In recent years, housing demand has outpaced housing supply, leading to a 52 percent increase in national home prices between 2012 and 2019. Over this period, 8.4 million new households formed in the U.S., but just 6.8 million new housing units were created, resulting in a shortage of about 1.6 million homes. The cost of acquiring land to develop upon is a major reason why housing supply has lagged behind demand. In San Francisco, where a typical home sells for over $1.5 million, land makes up over 50 percent, or $750,000, of that value. By contrast, the cost of land accounts for only 18 percent, or $35,000, of a typical home’s value in Indianapolis, where the median home price is $186,000. It is thus far easier to purchase land and build a home upon in Indianapolis than it is in San Francisco.
To quantify the impact of high land acquisition costs on housing supply and prices, we calculated the average share of home values taken up by the value of land, using data on land and home values from the 2017 property tax assessment files1.
The amount of the typical home’s value accounted for by land tends to be the highest in the expensive coastal markets. For example, a parcel of vacant land in San Jose can cost $500,000 or more. Add to that the costs of building materials, acquiring permits and construction labor, a new home would need to sell for over $1 million in for the developer to break even. This suggests that potential homebuyers who could have afforded to buy a home priced closer to the cost of constructing it are priced out because the high cost of land makes the final price of the home unaffordable. By contrast, the reason why San Antonio or Cincinnati are affordable is because the value of land only makes up roughly 20 percent of their home values, the rest being the cost of the structure.
Of the 100 metros analyzed, here at the top 20 and bottom 20 metro areas by average share of home values.
| Top 20 Metro areas ranked by land’s share of home values | Bottom 20 Metro areas ranked by land’s share of home values | ||||
| Metro Area | Average Land Share of Home Values | Median Sale Price | Metro Area | Average Land Share of Home Values | Median Sale Price |
| Los Angeles, CA | 60.9% | $625,000 | Huntington, WV* | 14.7% | $49,000 |
| San Jose, CA | 60.4% | $1,175,000 | Buffalo, NY | 15.9% | $155,000 |
| Santa Cruz, CA | 58.0% | $823,500 | Indianapolis, IN | 18.0% | $194,500 |
| San Diego, CA | 54.2% | $585,000 | Omaha, NE | 18.5% | $222,000 |
| Salinas, CA | 53.4% | $614,000 | Cedar Rapids, IA* | 18.6% | $129,700 |
| San Francisco, CA | 51.5% | $1,500,000 | Davenport, IA* | 19.4% | $80,034 |
| Boston, MA | 50.6% | $517,000 | Des Moines, IA | 20.1% | $215,000 |
| San Luis Obispo, CA | 48.3% | $599,500 | Fayetteville, NC* | 20.3% | $124,375 |
| New York, NY | 46.3% | $385,000 | Greenville, SC | 20.8% | $220,500 |
| Oakland, CA | 44.7% | $760,000 | Syracuse, NY | 20.8% | $144,000 |
| Providence, RI | 43.9% | $294,950 | San Antonio, TX | 21.4% | $237,500 |
| New Haven, CT | 43.7% | $221,500 | Philadelphia, PA | 21.9% | $225,000 |
| Newark, NJ | 43.5% | $370,000 | Greensboro, NC | 22.1% | $175,200 |
| Boulder, CO | 43.4% | $530,000 | Duluth, MN | 22.2% | $148,900 |
| Washington, DC | 42.1% | $423,000 | Lynchburg, VA* | 22.3% | $123,850 |
| Seattle, WA | 42.1% | $593,000 | Utica, NY* | 22.3% | $61,400 |
| Hickory, NC* | 41.3% | $162,500 | Louisville, KY | 22.3% | $205,000 |
| Portland, ME | 39.9% | $300,000 | Ocala, FL* | 22.5% | $74,455 |
| Santa Rosa, CA | 39.7% | $640,000 | Columbia, SC* | 22.7% | $119,945 |
| Trenton, NJ | 39.5% | $241,000 | Cincinnati, OH | 22.7% | $195,000 |
*Redfin service is not available in this market; the median sale price is from the 2017 tax assessor file.
Why does land’s share of home values vary so greatly across metro areas? Since the value of land reflects the demand for a location, strong job and wage growth are predictors of where land’s share of home value should be the greatest. But land can also become expensive because of stringent regulation (such as the length of time it takes to get a development project to be fully approved – it can take three times longer in the most regulated areas versus the least-regulated areas) and due to physical constraints facing new development (such as percentage of land at a slope greater than 15 degrees or land under water). In an academic paper, urban economist Dr. Albert Saiz of MIT’s urban economics lab, developed a ranking of metro areas by how difficult it is to increase the supply of housing due to factors attributed to regulatory and physical constraints alone.
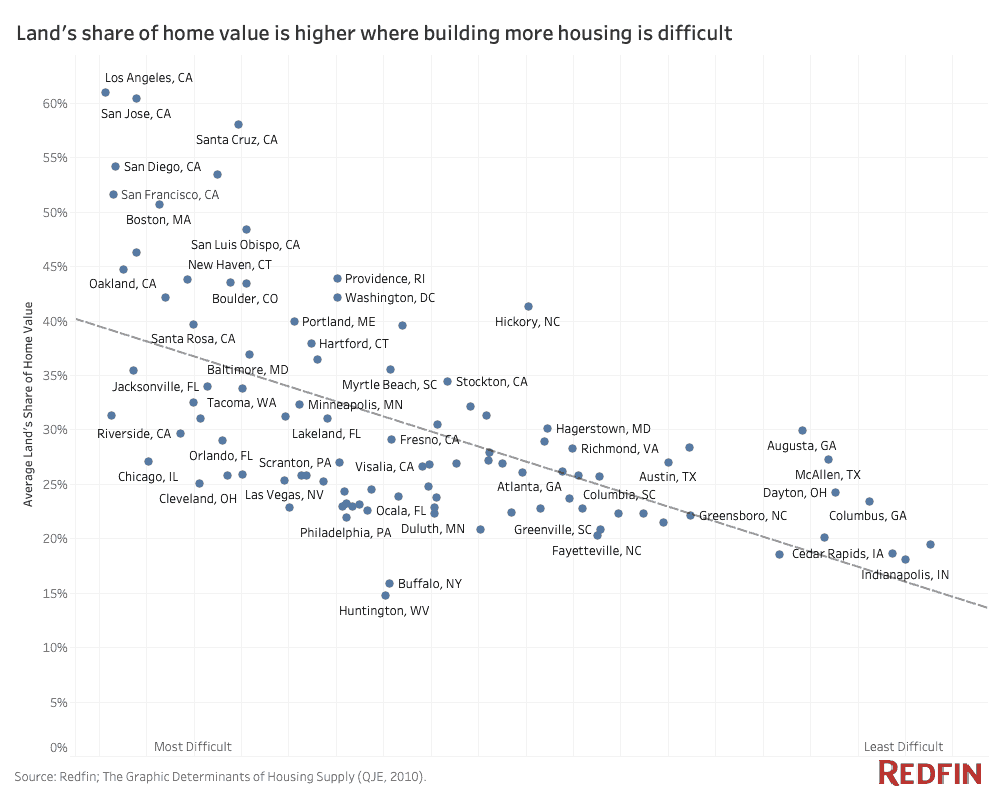
In metro areas where land’s share of home value is the greatest (Los Angeles, Boston, San Francisco, Seattle and Boulder), it is most difficult to build housing because of land availability and regulation. For example, Boulder has an urban growth boundary and many towns in Boston metro impose a minimum lot size requirement. The average land share of home value is roughly 41 percent across these metro areas and their median sale prices are higher than the national average. In terms of regulatory environments, it is comparatively easier to build new homes in metros such as Minneapolis, Las Vegas and Nashville. For instance, Minneapolis recently abolished single-family zoning whereas a bill seeking to expand housing in California (SB 50) was delayed for consideration until 2020. Lastly, housing supply is easiest to expand in metros such as San Antonio, Des Moines, Dayton and Omaha where land’s share of home values is on average about 23 percent. Permits are quicker and easier to obtain and there is plenty of land available to build upon.
These results shed light on why much of the supply coming onto the already expensive market is often high-end and not starter homes. Simply put, the high cost of land has made it unprofitable for developers to build anything but the high-end properties. In order to make land cheaper to construct upon, there is a dire need for local and national policies that aim to remove regulatory and physical barriers to development. Policies can target:
- Removing zoning restrictions such as minimum lot size, impact fees, parking requirements, density and height restrictions. In places where land is not readily available, increasing density would spread the high value of land over many units, thereby reducing the price of each individual unit.
- Reducing the length of time to obtain a permit. It should only take a few months, not several years to get approvals from various boards ranging from city, state, county, design, environment, infrastructure or the planning commission.
- Purchasing land with governmental funds to allocate affordable housing.
1 In the “cost” based approach to assessing the value of a home (for property tax purposes), the cost of a home is equal to the cost of the land and the cost of replacing the structure. The land and home value used in this study are thus based on these calculations by the local tax assessors.


